
ACTIVE STORM TRACK →
PROPERTY-INSURANCE CLAIM HELP FL CITIESSC CITIESGUIDESTATESNEWSSITE MAPABOUT
HurricaneLaw.Pro, Florida and South Carolina property insurance claim resource HURRICANELAW.PRO
STORM ARCHIVE / 2022 LANDFALL 26.7°N 82.2°W
CAT 4 AT LANDFALL PEAK CAT 5 FL & SC · 2022 · 160 mph

Hurricane Ian

Landfall: Cayo Costa / Fort Myers Beach, FL; 2nd landfall Georgetown, SC · 2022-09-28. Florida's costliest hurricane: 700,000+ claims, roughly 3 in 10 residential claims closed without payment, a surge-vs-wind litigation wave, and the SB 2-A overhaul of Florida claim law.

STORM FOOTAGE
AT LANDFALL
CAT 4
PEAK INTENSITY
CAT 5 · 160 mph
PRESSURE
941 mb
STORM SURGE
10-15 ft
DAMAGE
$112.9B
DEATHS
156 US
01 THE PATH

Where it hit, start to finish

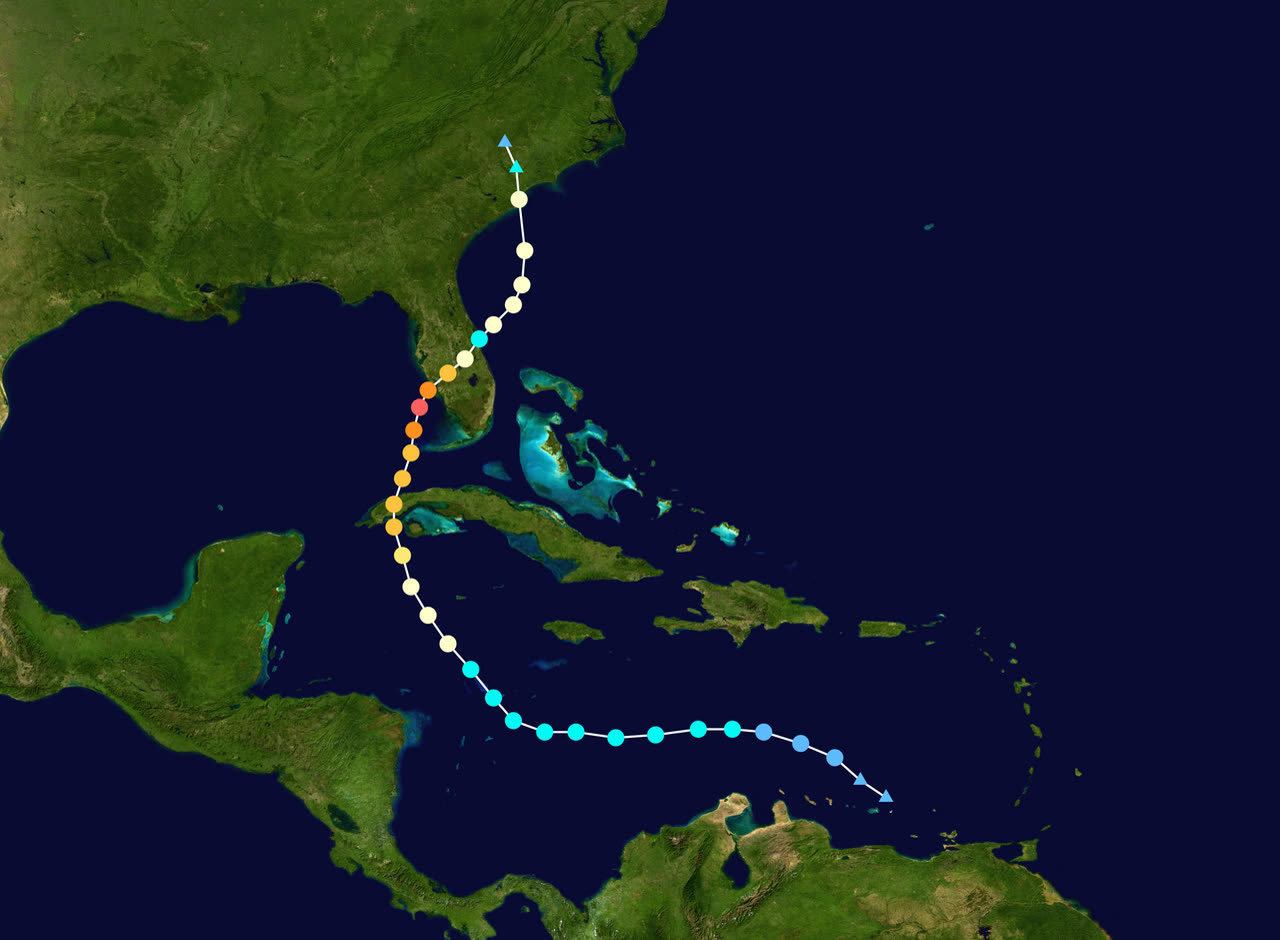
TRACK · HURRICANE IANNOAA / NHC best-track data
Best track of Hurricane Ian: Caribbean → Cuba → Cayo Costa, FL → Georgetown, SC
La Coloma, Cuba
CAT 3 LANDFALL · 125 MPH

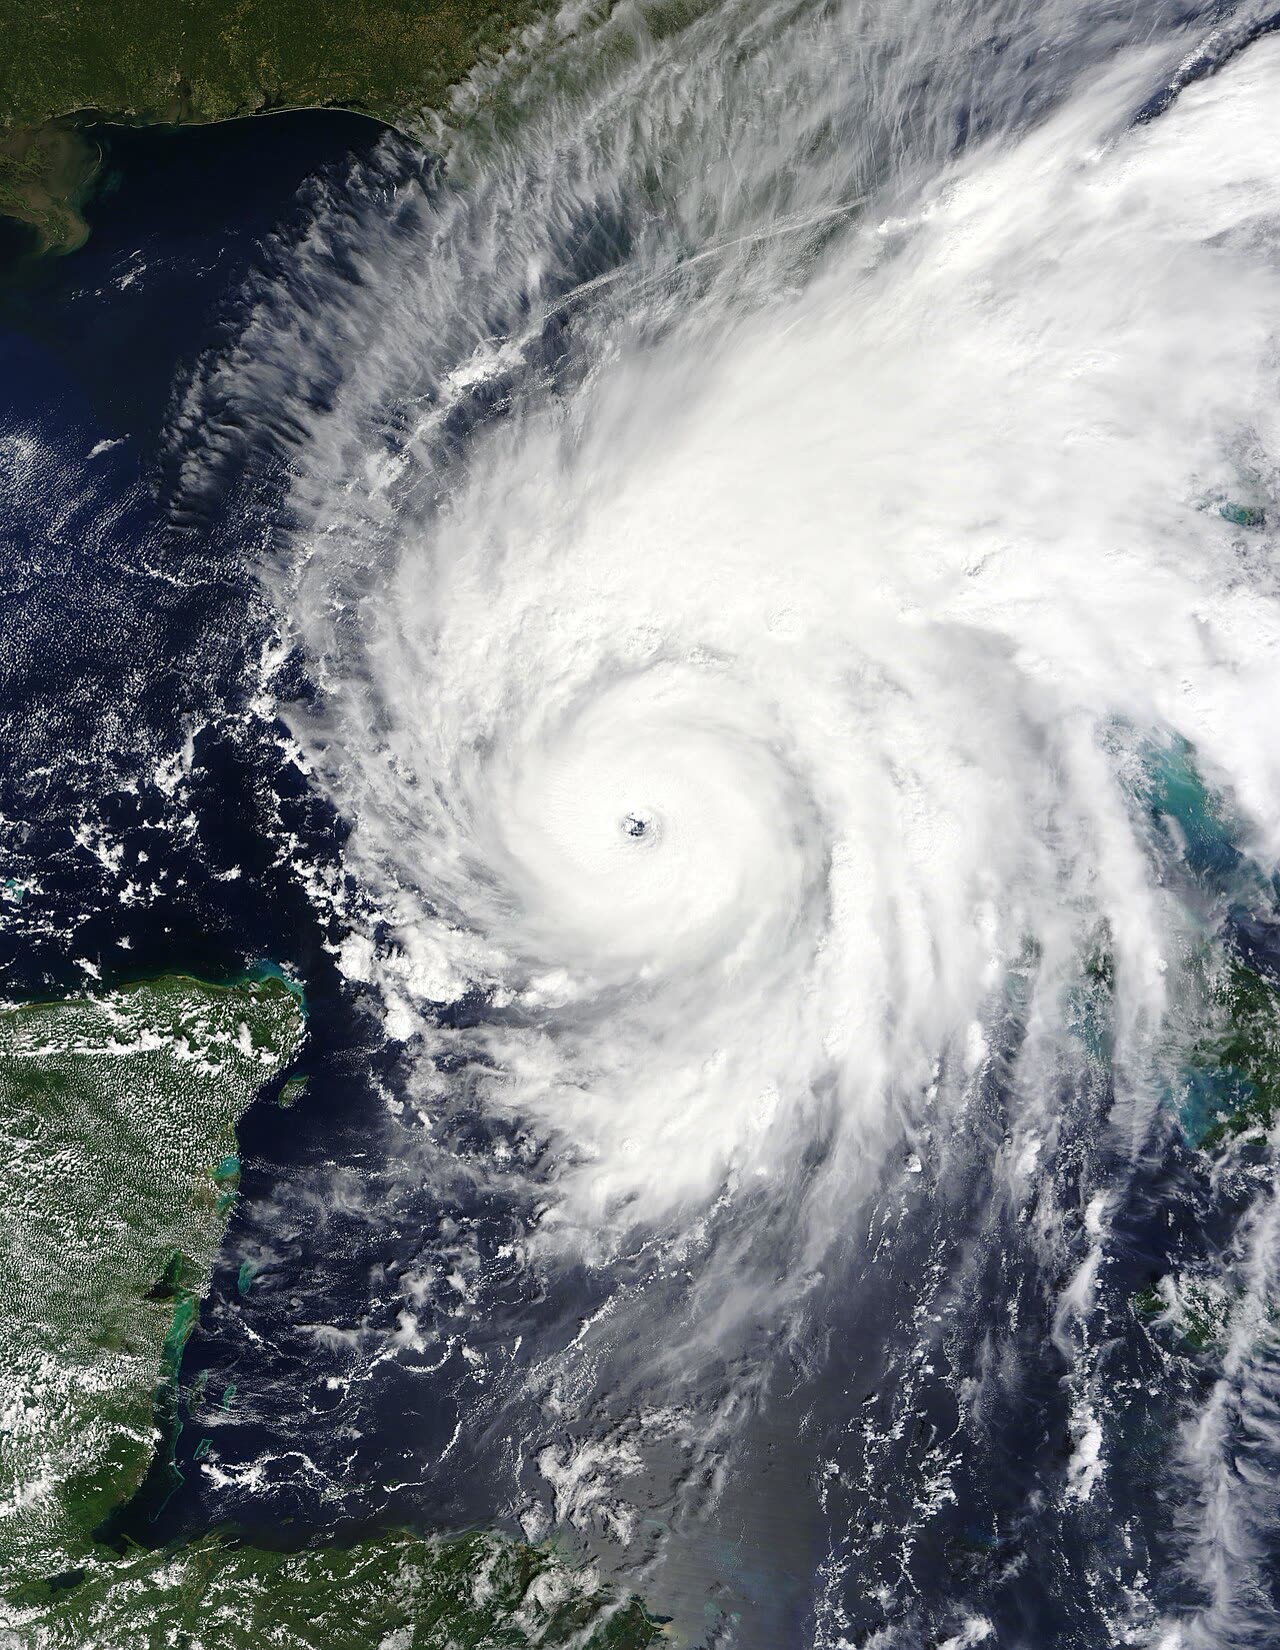
Ian struck Pinar del Río province on September 27 as a Category 3, wrecking Cuba's tobacco heartland and knocking out power to the entire island.

Cayo Costa, FL
CAT 4 LANDFALL · 150 MPH · 941 MB

After peaking at Category 5 (160 mph) that morning, Ian came ashore at 3:05 PM EDT September 28 as a high-end Category 4, tied among the strongest landfalls in Florida history.

Fort Myers Beach / Sanibel, FL
10-15 FT STORM SURGE

The right-front quadrant drove 10-15 ft of surge across Fort Myers Beach, Sanibel, and Estero Island. Entire blocks were swept to the slab, the Sanibel Causeway failed, and most of the storm's 66 direct U.S. deaths were surge drownings here.

Fort Myers / Cape Coral / Punta Gorda, FL
STRAIGHT-WIND DEMOLITION · GUSTS ~140 MPH

On the dry side of the eye, sustained hurricane-force wind with gusts near 140 mph at Cape Coral shredded roofs across Lee and Charlotte counties, one of the worst combined wind-and-surge demolition events in Florida history. Lee County alone generated 229,000+ claims.

Arcadia / Peace River, FL
RECORD RIVER FLOOD · ~24 FT CREST

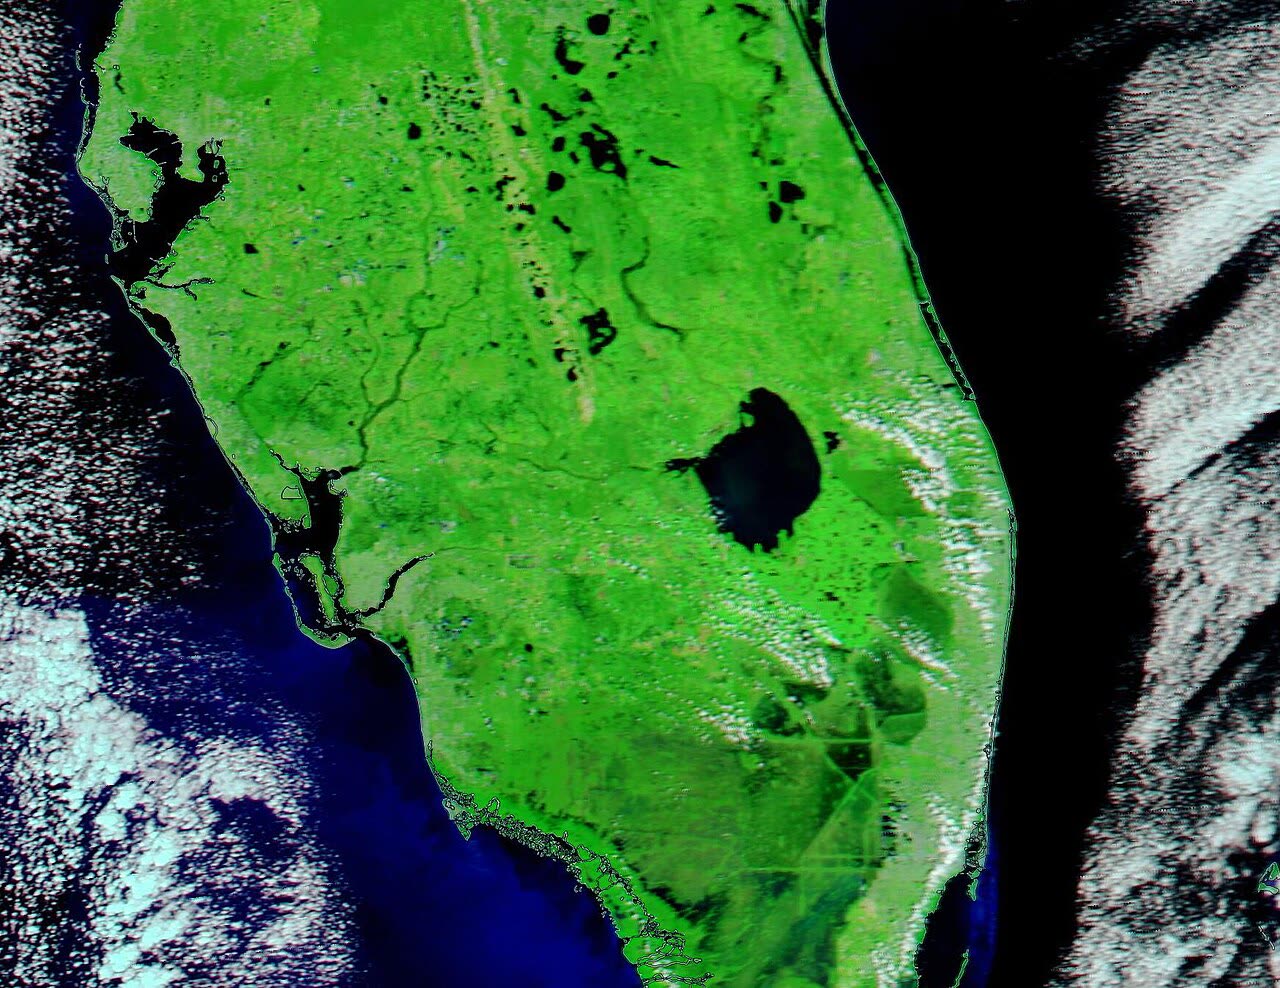
Days after landfall the Peace River at Arcadia crested near 24 ft, the highest level in more than 90 years of USGS record, flooding roughly 2,000 homes in DeSoto County long after the wind had stopped.

Orlando / Central FL
10-20 IN RAIN · FRESHWATER FLOODING

Ian dumped 10-20 inches across central Florida, flooding Orlando-area neighborhoods and driving record crests along the St. Johns basin, much of it outside mapped flood zones and uninsured for flood.

Georgetown, SC
2ND U.S. LANDFALL · CAT 1 · 80 MPH

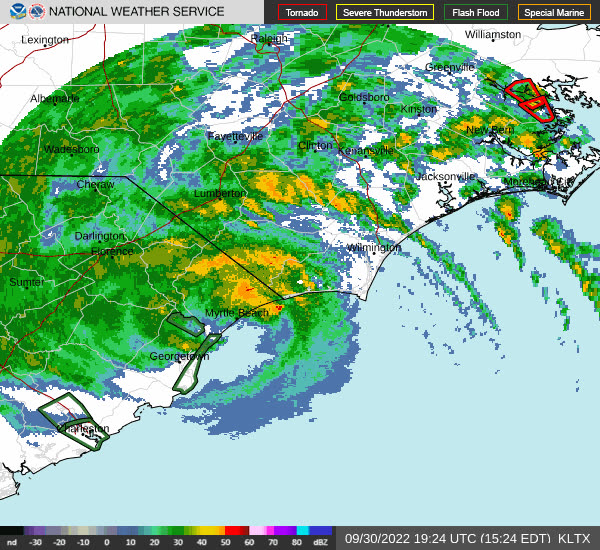
Ian's final landfall on September 30 pushed surge along the Charleston-to-Myrtle Beach coast and cut the Pawleys Island pier in half.

02 THE RECORD IN IMAGES
ALL IMAGERY U.S. GOV / PUBLIC DOMAIN
SATELLITE NASA / MODIS
Ian crossing western Cuba as a Category 3, September 27, 2022, the island lost power nationwide
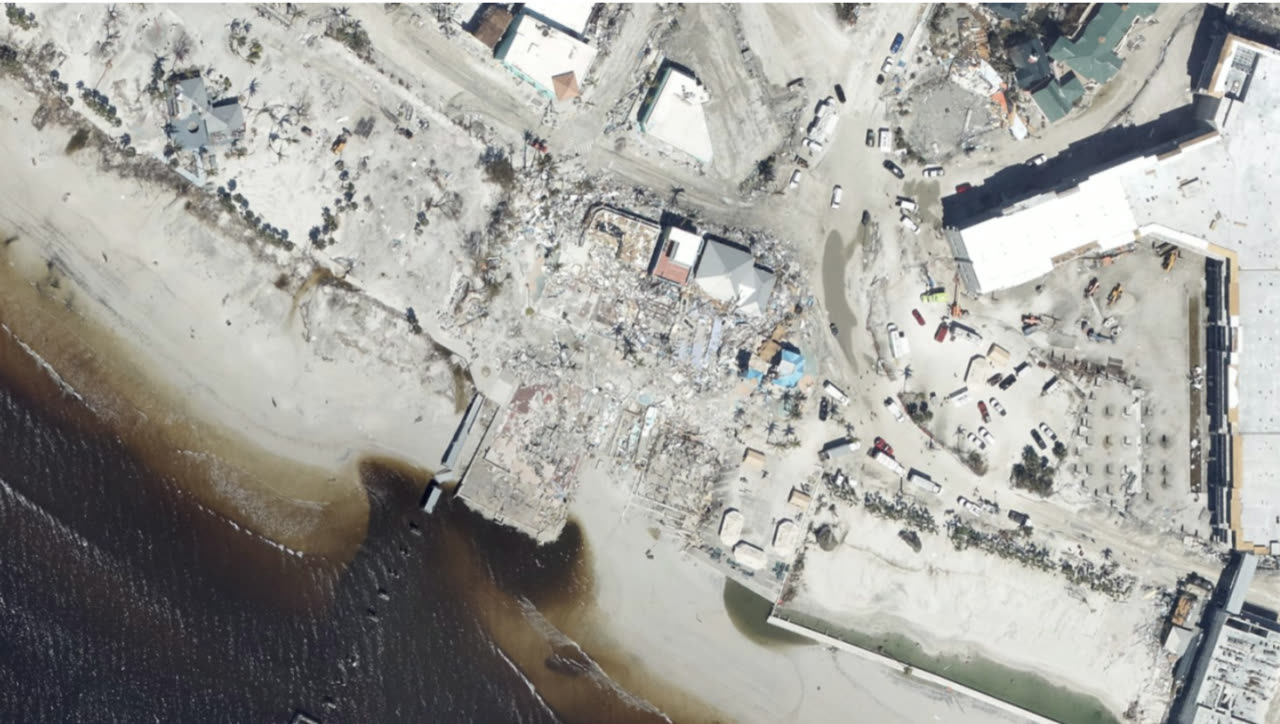
DAMAGE NOAA
The Times Square district of Fort Myers Beach, stripped to the slab by surge and wind
FLOOD NASA / MODIS
Satellite view of Florida's swollen rivers, including the Peace River basin, five days after landfall
RADAR NOAA / NWS
NWS Wilmington radar loop of Ian's second U.S. landfall near Georgetown, South Carolina, September 30, 2022

The storm

Ian organized in the central Caribbean on September 23, 2022, crossed western Cuba as a Category 3 on the 27th, and entered the southeastern Gulf with a clear runway: deep warm water, low shear. It intensified to Category 5 (160 mph peak) on the morning of September 28, then made landfall that afternoon at Cayo Costa, a barrier island west of Fort Myers, as a high-end Category 4, 150 mph sustained, 941 mb (NHC Tropical Cyclone Report). A second Florida landfall followed near Punta Gorda.

The track mattered as much as the intensity. A late eastward wobble put the strongest right-front surge quadrant onto Fort Myers Beach, Sanibel, and Estero Island instead of Tampa Bay. NHC's report puts peak inundation at 10-15 ft above ground in that zone.

Ian then crossed the peninsula slowly, dumping 10-20 inches of rain across central Florida and driving record river flooding along the Peace, Myakka, and St. Johns basins, freshwater flood damage far inland from the surge. It re-emerged over the Atlantic and made a final landfall near Georgetown, South Carolina, on September 30 as a Category 1, pushing surge into the Charleston-to-Myrtle Beach coast and cutting several fishing piers in half.

NHC forecast cone, Advisory 24, 11 AM EDT September 28, hours before landfall
NHC forecast cone, Advisory 24, 11 AM EDT September 28, hours before landfall NOAA / NHC

The damage

Fort Myers Beach was the epicenter: rows of homes and businesses along Estero Boulevard were removed to the slab by surge. The Sanibel Causeway failed in multiple sections, cutting the island off. Boats stacked in marinas and on streets became the storm's signature image. In Lee County alone, FLOIR-tracked claims exceeded 229,000.

Inland, the damage profile shifted from surge to wind and freshwater flood: roof and screen-enclosure failures across Charlotte, Lee, and Collier counties, and days-later river flooding that inundated homes in Orlando-area neighborhoods, North Port, and along the St. Johns, many of them outside FEMA high-risk flood zones and uninsured for flood.

NHC's report attributes $112.9 billion in U.S. damage, the third-costliest U.S. hurricane on record and the costliest in Florida history, and 156 U.S. deaths, 66 of them direct. Most direct deaths were storm-surge drownings in southwest Florida.
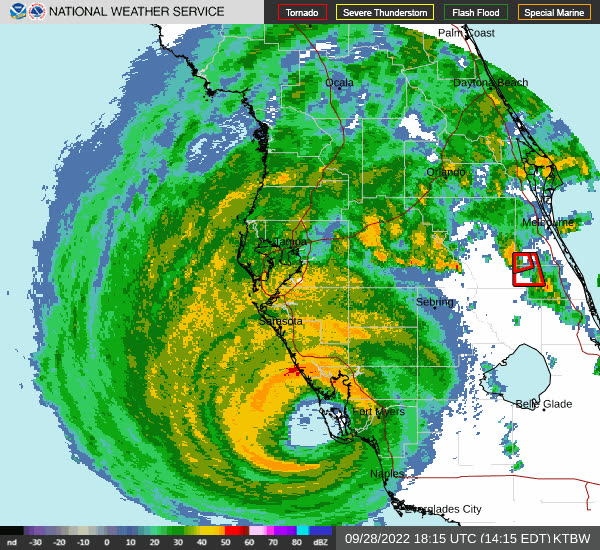
NWS Tampa Bay radar loop of Ian's Category 4 landfall at Cayo Costa, September 28, 2022
NWS Tampa Bay radar loop of Ian's Category 4 landfall at Cayo Costa, September 28, 2022 NOAA / NWS

The insurance aftermath

The claim volume was immediate and immense. FLOIR's catastrophe reporting logged 640,496 claims by late November 2022; filings ultimately exceeded 770,000 across all lines. Estimated insured losses in FLOIR data climbed from $7.13 billion (late October) to $10.3 billion within two months and kept rising through 2023 as litigation and supplemental claims developed.

The defining dispute was surge vs. wind. On the barrier islands, carriers attributed slab-only losses to excluded storm surge, pushing recovery to NFIP flood policies with $250,000 dwelling caps, or to nothing, where owners carried no flood coverage. Policyholders countered with engineering opinions that wind destroyed structures before surge arrived. Inland, the mirror-image fight: freshwater river flooding weeks after landfall, excluded under homeowners policies, in neighborhoods where flood insurance take-up was low.

Closure statistics drew regulatory attention: of 565,101 residential claims in FLOIR data, 157,445, roughly 28 percent, were closed without payment. Carriers cited flood exclusions, damage below hurricane deductibles, and duplicate filings; policyholder attorneys cited the numbers as evidence of systematic underpayment. Florida regulators later fined multiple insurers over Ian claims-handling failures.

Ian hit a market already failing. Six Florida property insurers went insolvent during 2022 before and around the storm, and FIGA assessments followed. Reinsurance costs spiked at the January 2023 renewals.

The legislative response was the most significant rewrite of Florida claim law in decades. In a December 2022 special session, SB 2-A:

  • eliminated one-way attorney's fees in property-insurance suits, the fee engine behind Florida's outsized litigation volume;
  • banned assignment-of-benefits agreements on new policies, finishing what 2019's HB 7065 started after Irma;
  • cut the claim-filing deadline to 1 year (18 months for supplemental claims);
  • shortened the pay-or-deny window from 90 to 60 days;
  • created programs to move policies out of Citizens.

Whether SB 2-A stabilized the market or shifted leverage against policyholders is contested; both litigation filings and insolvencies slowed in the following two years, while claim-denial disputes moved into appraisal and pre-suit notice processes.
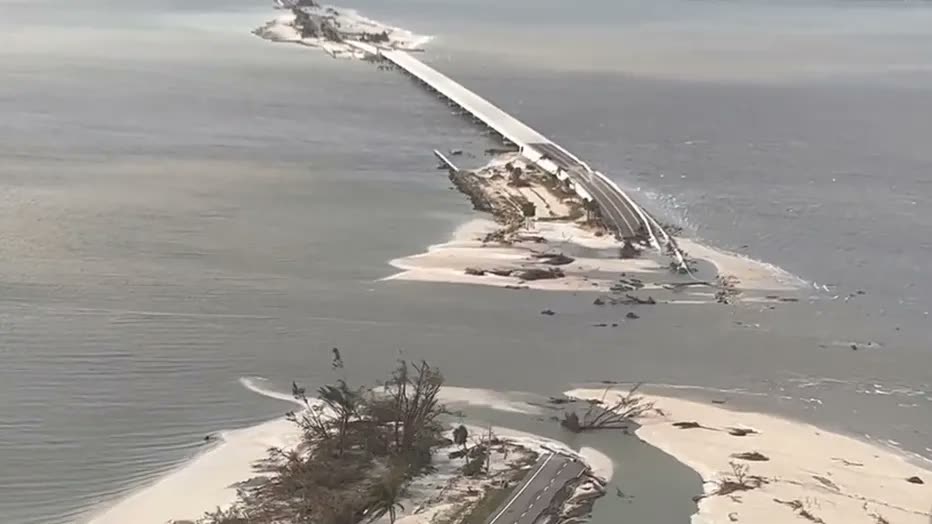
The Sanibel Causeway, breached in multiple sections by storm surge, Sanibel was cut off from the mainland
The Sanibel Causeway, breached in multiple sections by storm surge, Sanibel was cut off from the mainland Lee County Sheriff's Office

What policyholders learned

  • The flood gap was the single biggest uncovered loss. Surge and river flooding are excluded from homeowners policies; inland flooded households outside mapped flood zones were largely uninsured. Documented flood-policy take-up, not policy wording, decided many outcomes.
  • Causation evidence had to be built early. Slab cases turned on wind-vs-water sequencing. Policyholders who preserved time-stamped photos and video, wind data, witness accounts, and pre-repair site conditions gave their engineers something to work with; sites cleared before documentation lost the argument.
  • "Closed without payment" was a status, not a verdict. Many CWOP claims were re-opened with supplemental documentation, contractor estimates, moisture readings, engineer reports, and paid. Policyholders treated the first denial as the start of the file, not the end.
  • Deadlines compressed. Post-SB 2-A, Florida claims run on a 1-year filing clock and carriers on a 60-day pay-or-deny clock. Ian claimants who filed fast, even with incomplete damage knowledge, preserved rights that late filers lost.
  • Hurricane deductibles surprised at scale. Percentage deductibles (2-10 percent of dwelling limit) zeroed out mid-sized wind claims. Policyholders learned the deductible math before disputing the estimate: a denial for "damage below deductible" is a scope argument, not a coverage argument.
  • Separate policies, separate claims. Wind, flood (NFIP), and contents each required their own claim, proof, and appeal track. Filing all of them promptly, even when the responsible policy was disputed, kept every recovery path open.

Not legal advice; consult an attorney about your specific claim. Damage figures are nominal (not inflation-adjusted) unless noted.

AT LANDFALL · HURRICANE IAN · 2022
10-15 ft
OF STORM SURGE
REPRESENTATIVE FOOTAGE
03 THE FULL RECORD

Every official record of Ian

Reports, imagery archives, flood data, and claims records, straight from the agencies.

FREE CASE REVIEW · NO FEE UNLESS YOU RECOVER
Ian claim denied?
CALL SC · 843-542-0454CALL FL · 813-588-0164FREE CLAIM REVIEW
RELATED GUIDES
HurricaneLaw.Pro, Florida and South Carolina property insurance claim resource HURRICANELAW.PRO

A comprehensive property-insurance claim resource for policyholders: denied and underpaid claims, coverage and bad-faith law, storm dossiers, carrier profiles, city guides, and the complete claims playbook. Florida and South Carolina.

▸ SEE THE FULL SITE MAP →
STORM ALERTS SOURCED FROM NOAA / NHC
SOUTH CAROLINA
496 Bramson Court, Suite 100
Mount Pleasant, SC 29464
CALL OR TEXT
FLORIDA
CALL OR TEXT
CLAIMS 9
BAD FAITH 7
DENIAL FILINGS
HOW CLAIMS GET DENIED
DENIAL DOCUMENTS
DENIALS, ANSWERED 9
COVERAGE 13
COMMERCIAL 8
ROOFS 8
TREES 5
DIRECTORIES
STORMS 51
WEATHER
NEWS & SITE 22
STORM ARCHIVE, CITIES & NEWS
Most recent below. Every storm dossier, city resource, and article is on its hub (linked at each heading) or the grouped site map →. All 73 carriers and 95 public-adjuster firms are in the Directories column above.
STORM ARCHIVE · 51 →
Hurricane Debby 2024Hurricane Helene 2024Hurricane Milton 2024Hurricane Idalia 2023Hurricane Ian 2022Hurricane Nicole 2022Hurricane Ida 2021Hurricane Laura 2020 View all 51 →
FLORIDA CITY RESOURCES · 37 →
Boca RatonBradentonCape CoralClearwaterCrestviewDaytona BeachDestinDunedin View all 37 →
SOUTH CAROLINA CITY RESOURCES · 8 →
BeaufortCharlestonColumbiaFlorenceGreenvilleHilton Head IslandMount PleasantMyrtle Beach
NEWS & UPDATES · 22 →

Coverage summaries, policy-language quotations, dollar figures, deadlines, and chart examples throughout this site are general information based on typical or standard policy forms and are illustrative only: they are not a quote, a guarantee of coverage, or a promise of any outcome. Every insurance policy is different: your own policy, endorsements, and state law control, so read your policy and confirm current statutes. Weather imagery courtesy of NOAA, the National Hurricane Center, and the National Weather Service. Legal services are provided by Halversen Law. Nothing on this site is legal advice; consult an attorney about your specific claim.

PrivacyTermsDisclaimerAboutContact
This site is not legal advice, and it is not a substitute for an attorney. Anything legal needs a licensed lawyer reading your policy and your facts. We recommend Halversen Law: the free claim review is the fastest way to get real eyes on your claim.
© 2026 HURRICANELAW.PRO · ALL RIGHTS RESERVED 27.9°N 82.5°W · ATLANTIC BASIN MONITOR
LAW FIRM
Halversen Law LICENSED · FLORIDA & SOUTH CAROLINA

Legal matters are handled by Halversen Law, a law firm licensed in Florida and South Carolina.

FREE CASE REVIEW