ACTIVE STORM TROPICAL STORM DOLLY, 40 MPH, MOVING W 28 TRACK DOLLY →
PROPERTY-INSURANCE CLAIM HELP FL CITIESSC CITIESGUIDESTATESNEWSSITE MAPABOUT
HurricaneLaw.Pro, Florida and South Carolina property insurance claim resource HURRICANELAW.PRO
FLORIDA /PANAMA CITY BEACH

Panama City Beach storm & claim resource

Flood zones, neighborhood-by-neighborhood storm risk, evacuation and insurance resources for Panama City Beach, plus a free review if a claim you already filed was denied or underpaid.

Local resources ↓ FREE CLAIM REVIEW →
WIND-BORNE DEBRIS
Yes, coastal Bay County
FLOOD ZONE
Much of the Gulf-front ridge maps Zone X or the 0.2 percent band; the VE and AE ground is at Carillon Beach and along Grand Lagoon, Bay Point and the West Bay shorelines
COUNTY
Bay County
FL NOTICE DEADLINE
1 year · § 627.70132
THE DAMAGE

The storm is the easy part. This is the claim.

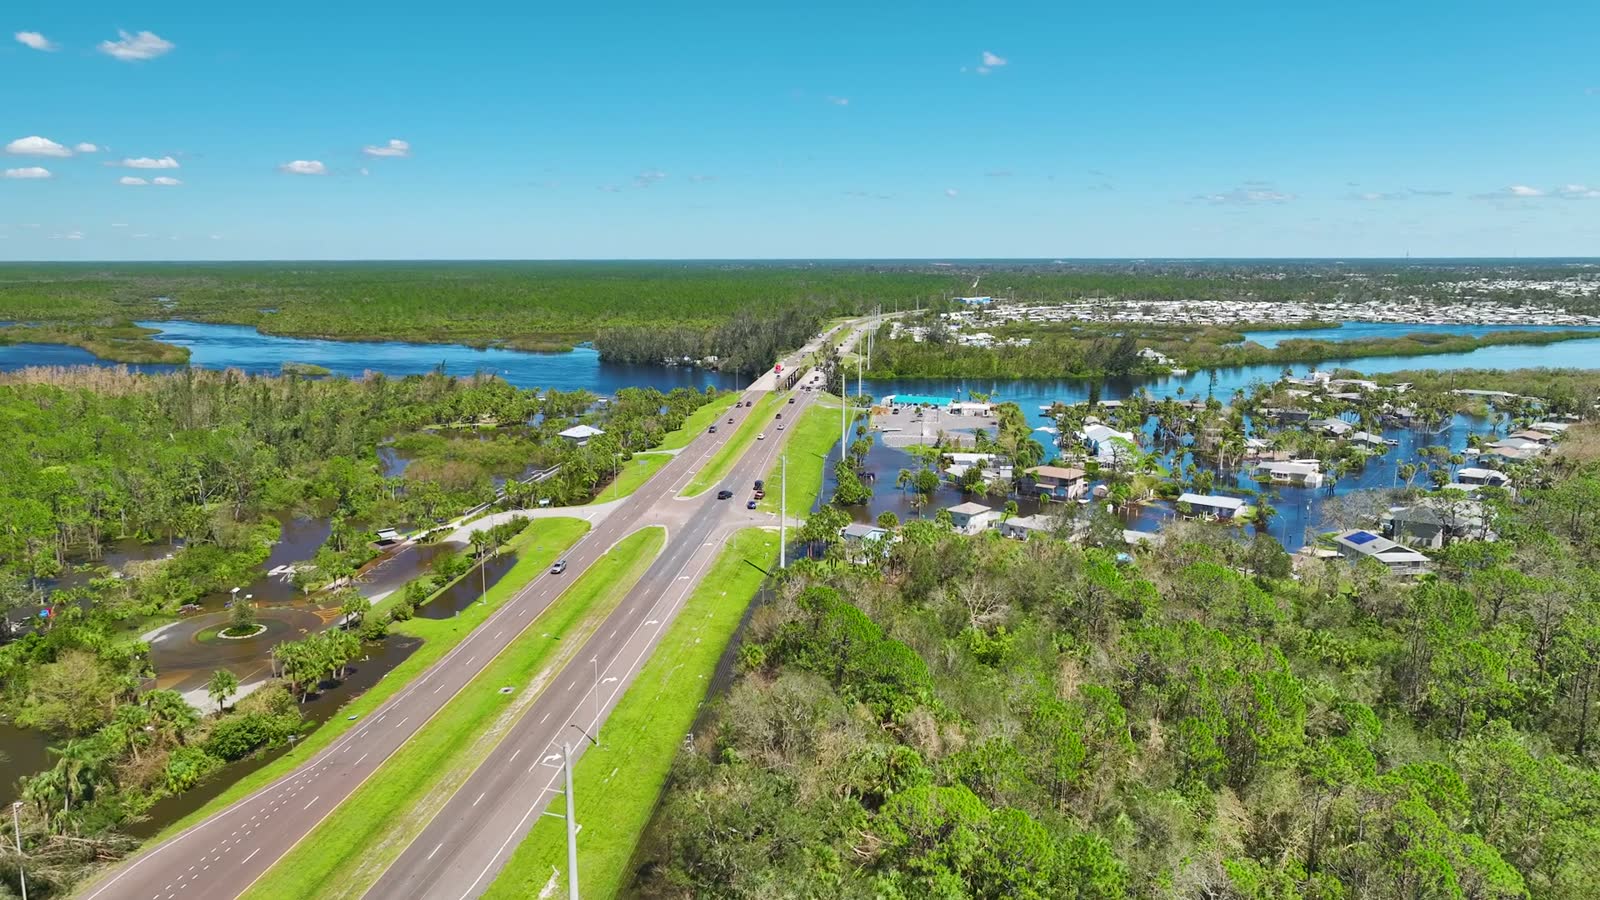
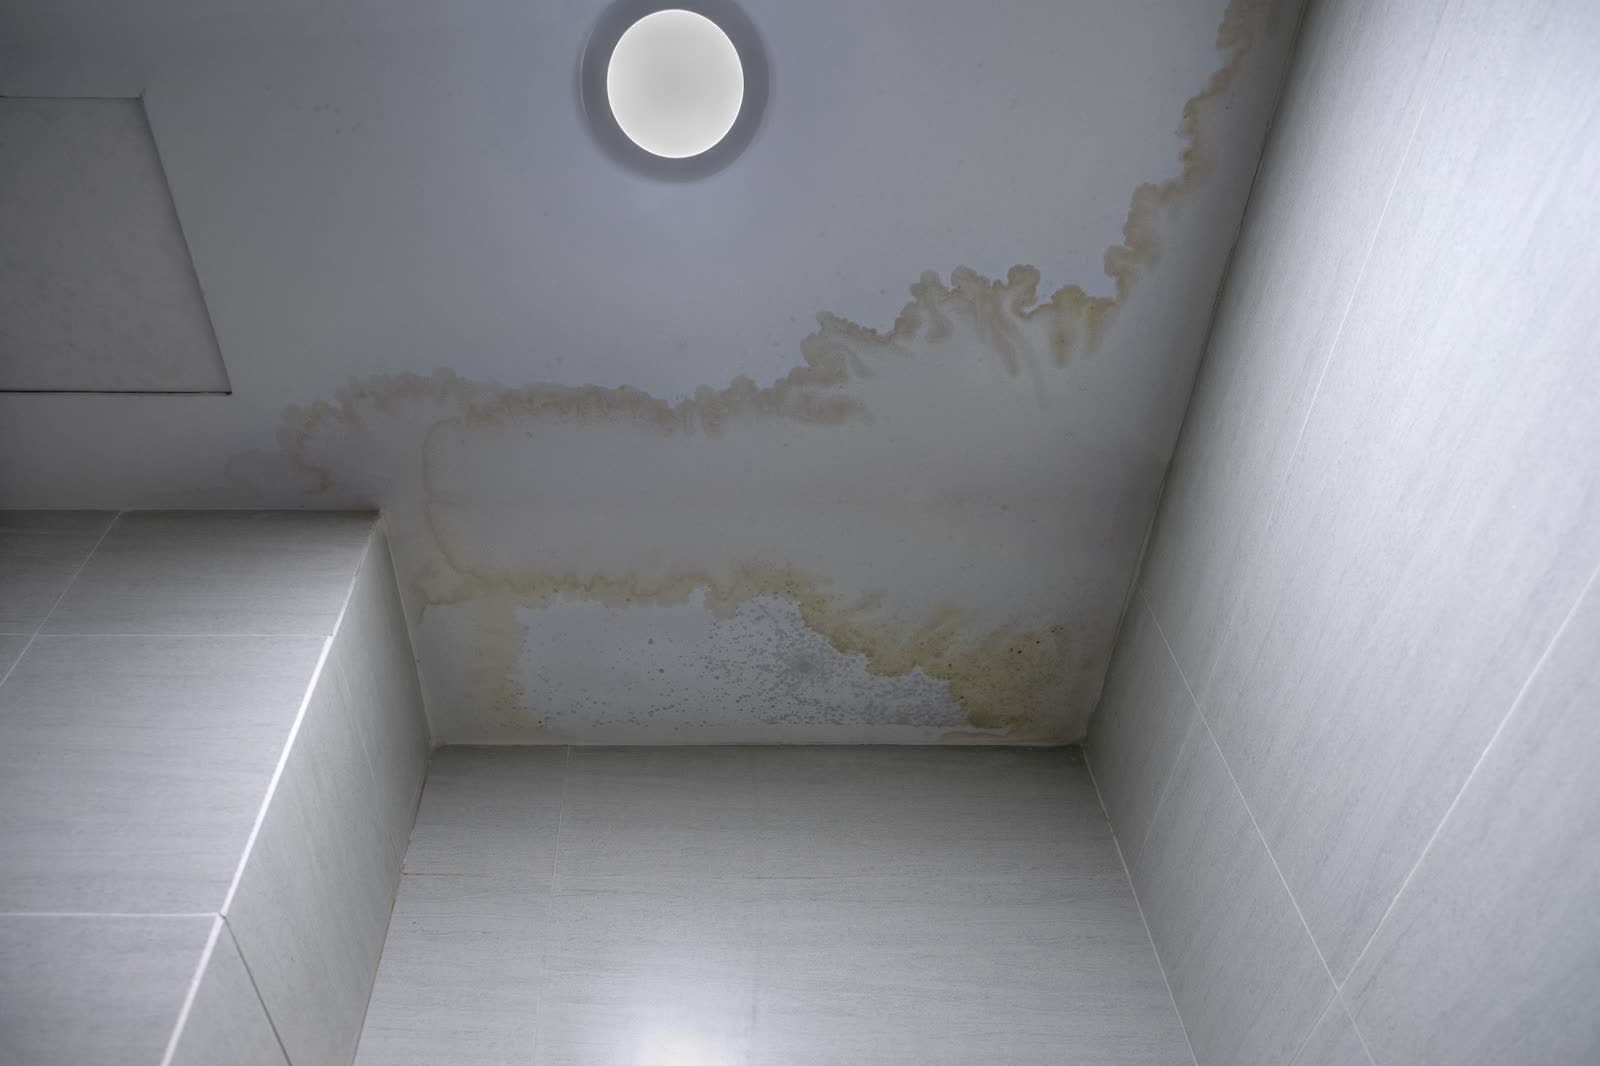
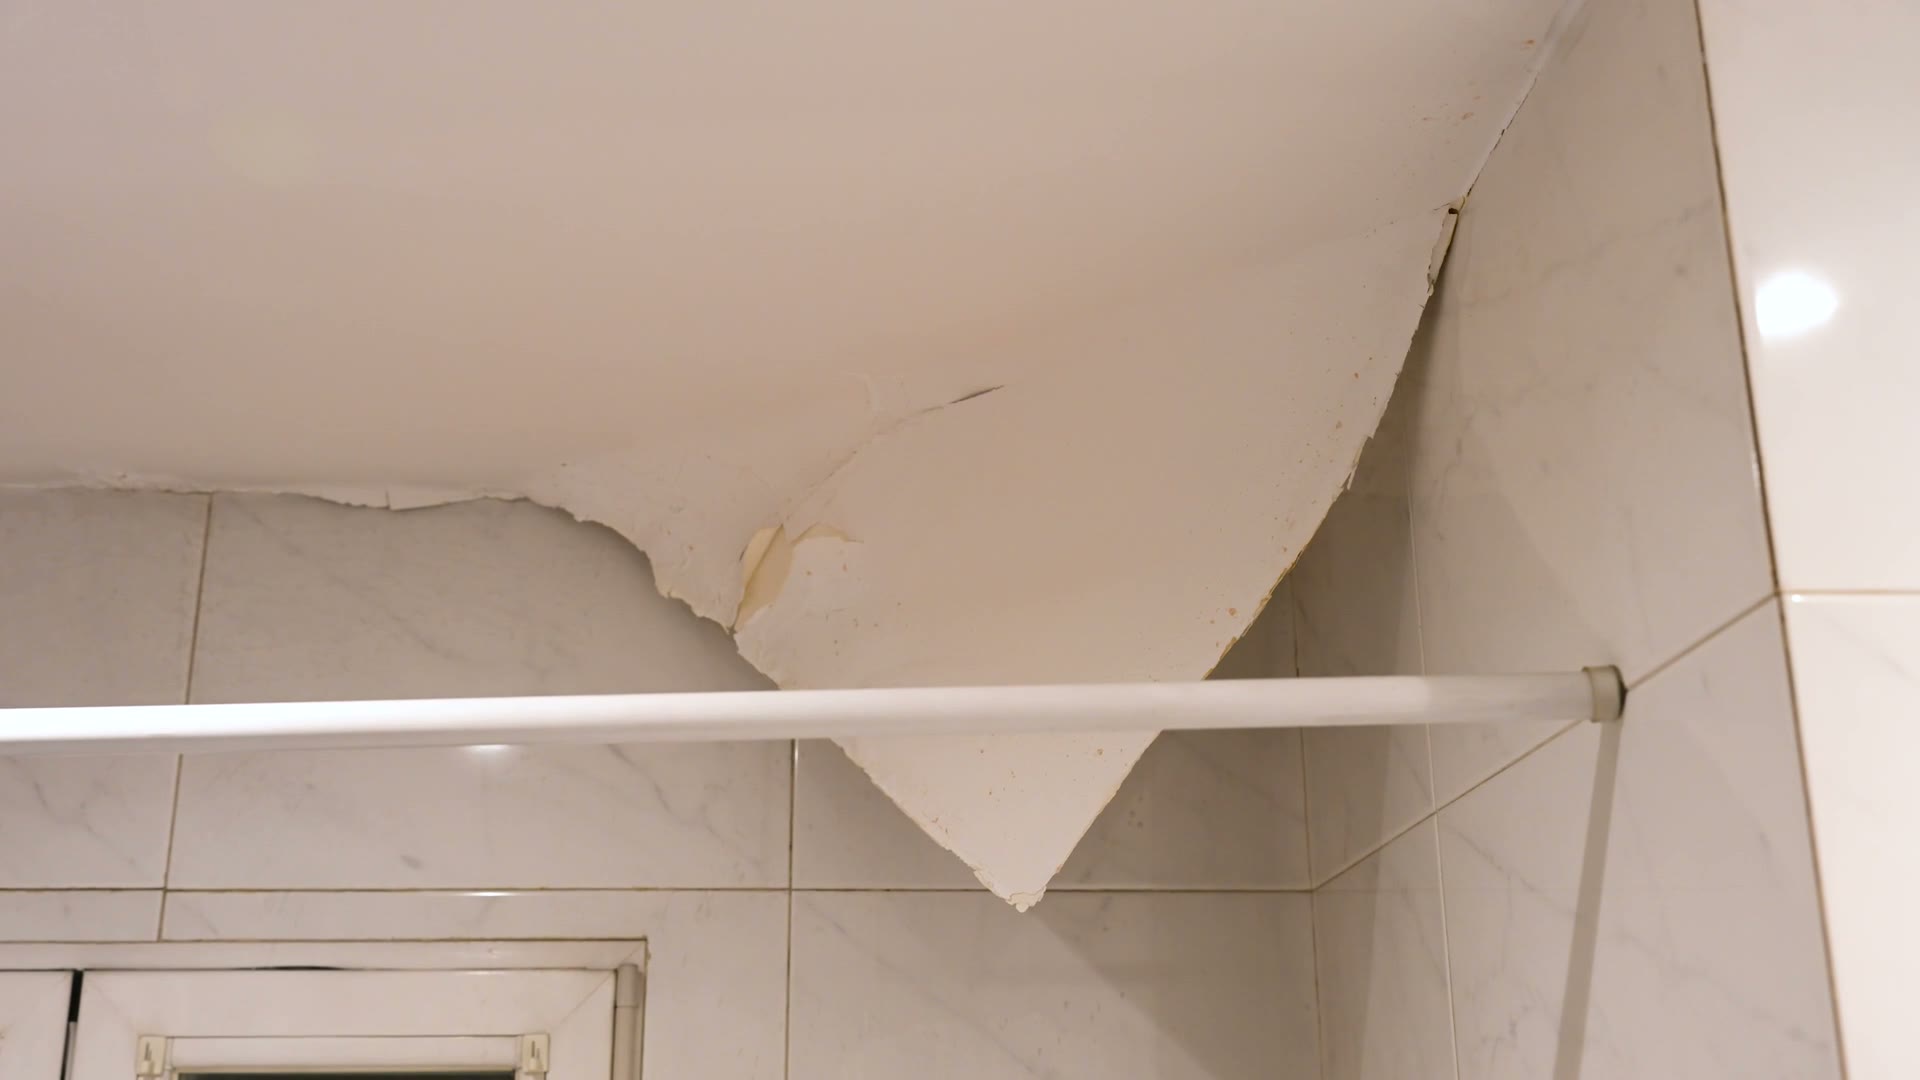
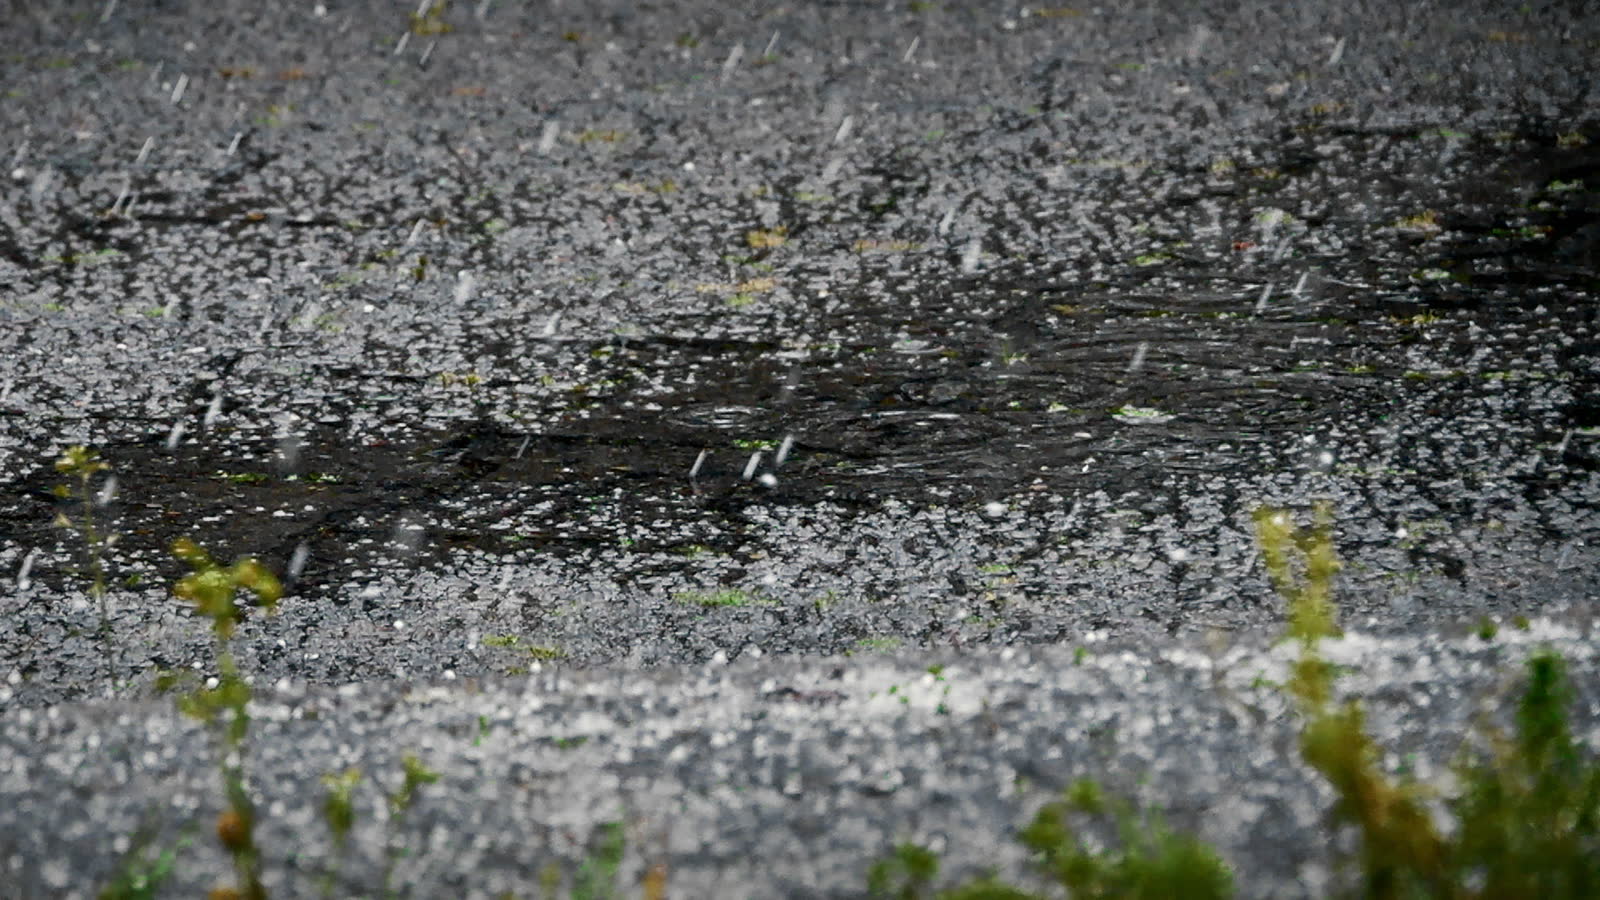
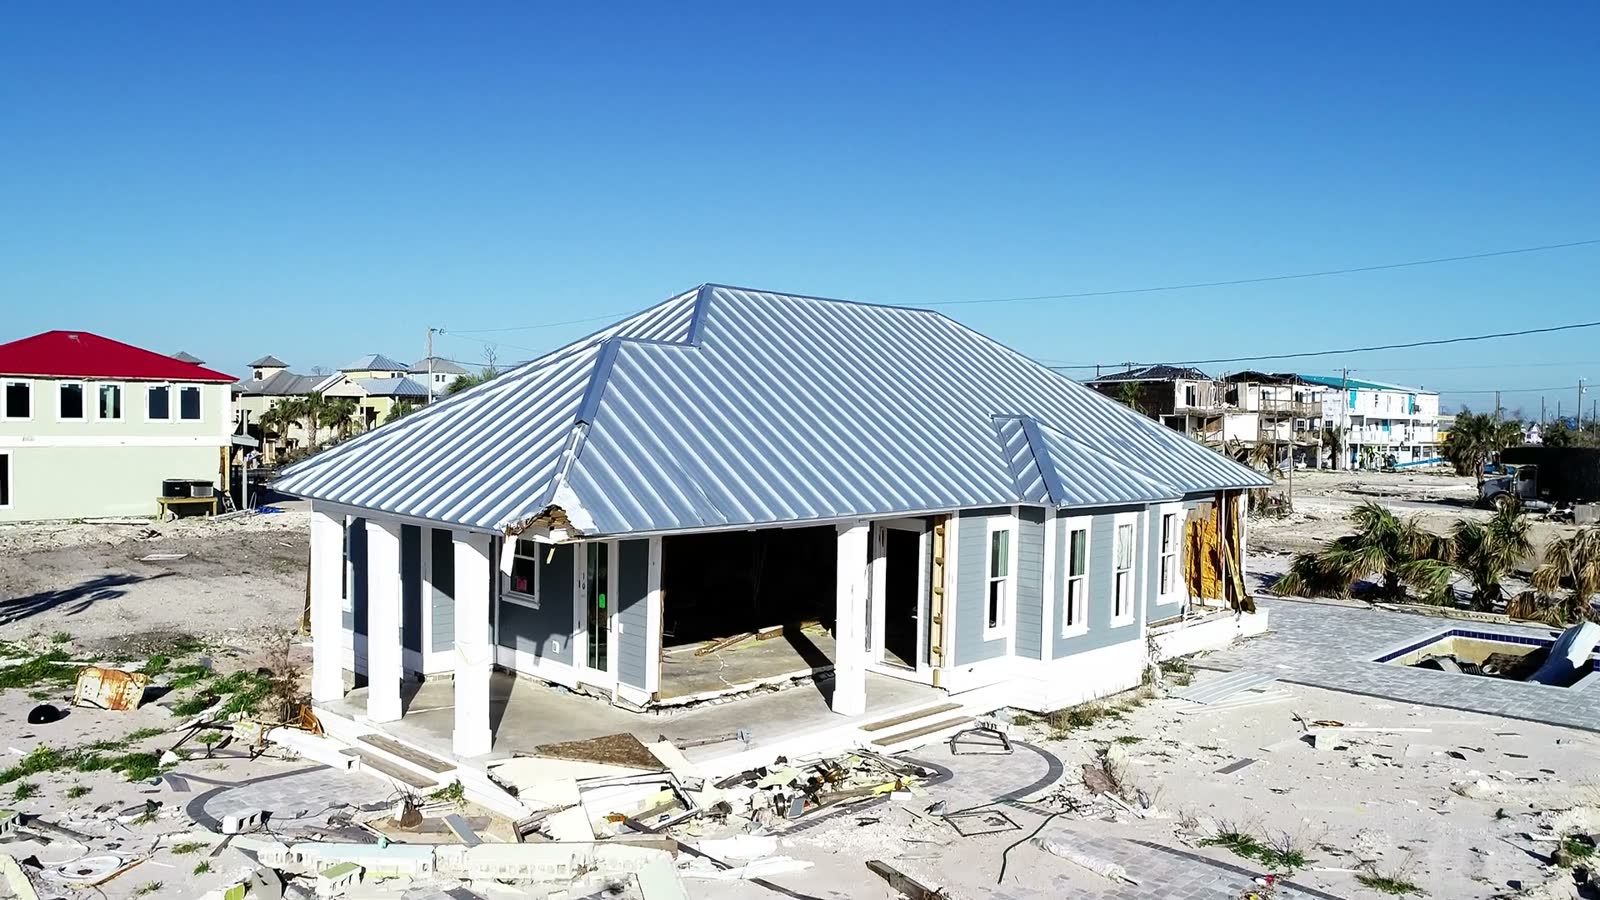
A denied or underpaid claim isn’t about the weather, it’s about the damage the carrier won’t pay for. Torn-off roofs, water through the ceiling, flooded ground floors, hail-struck slopes.

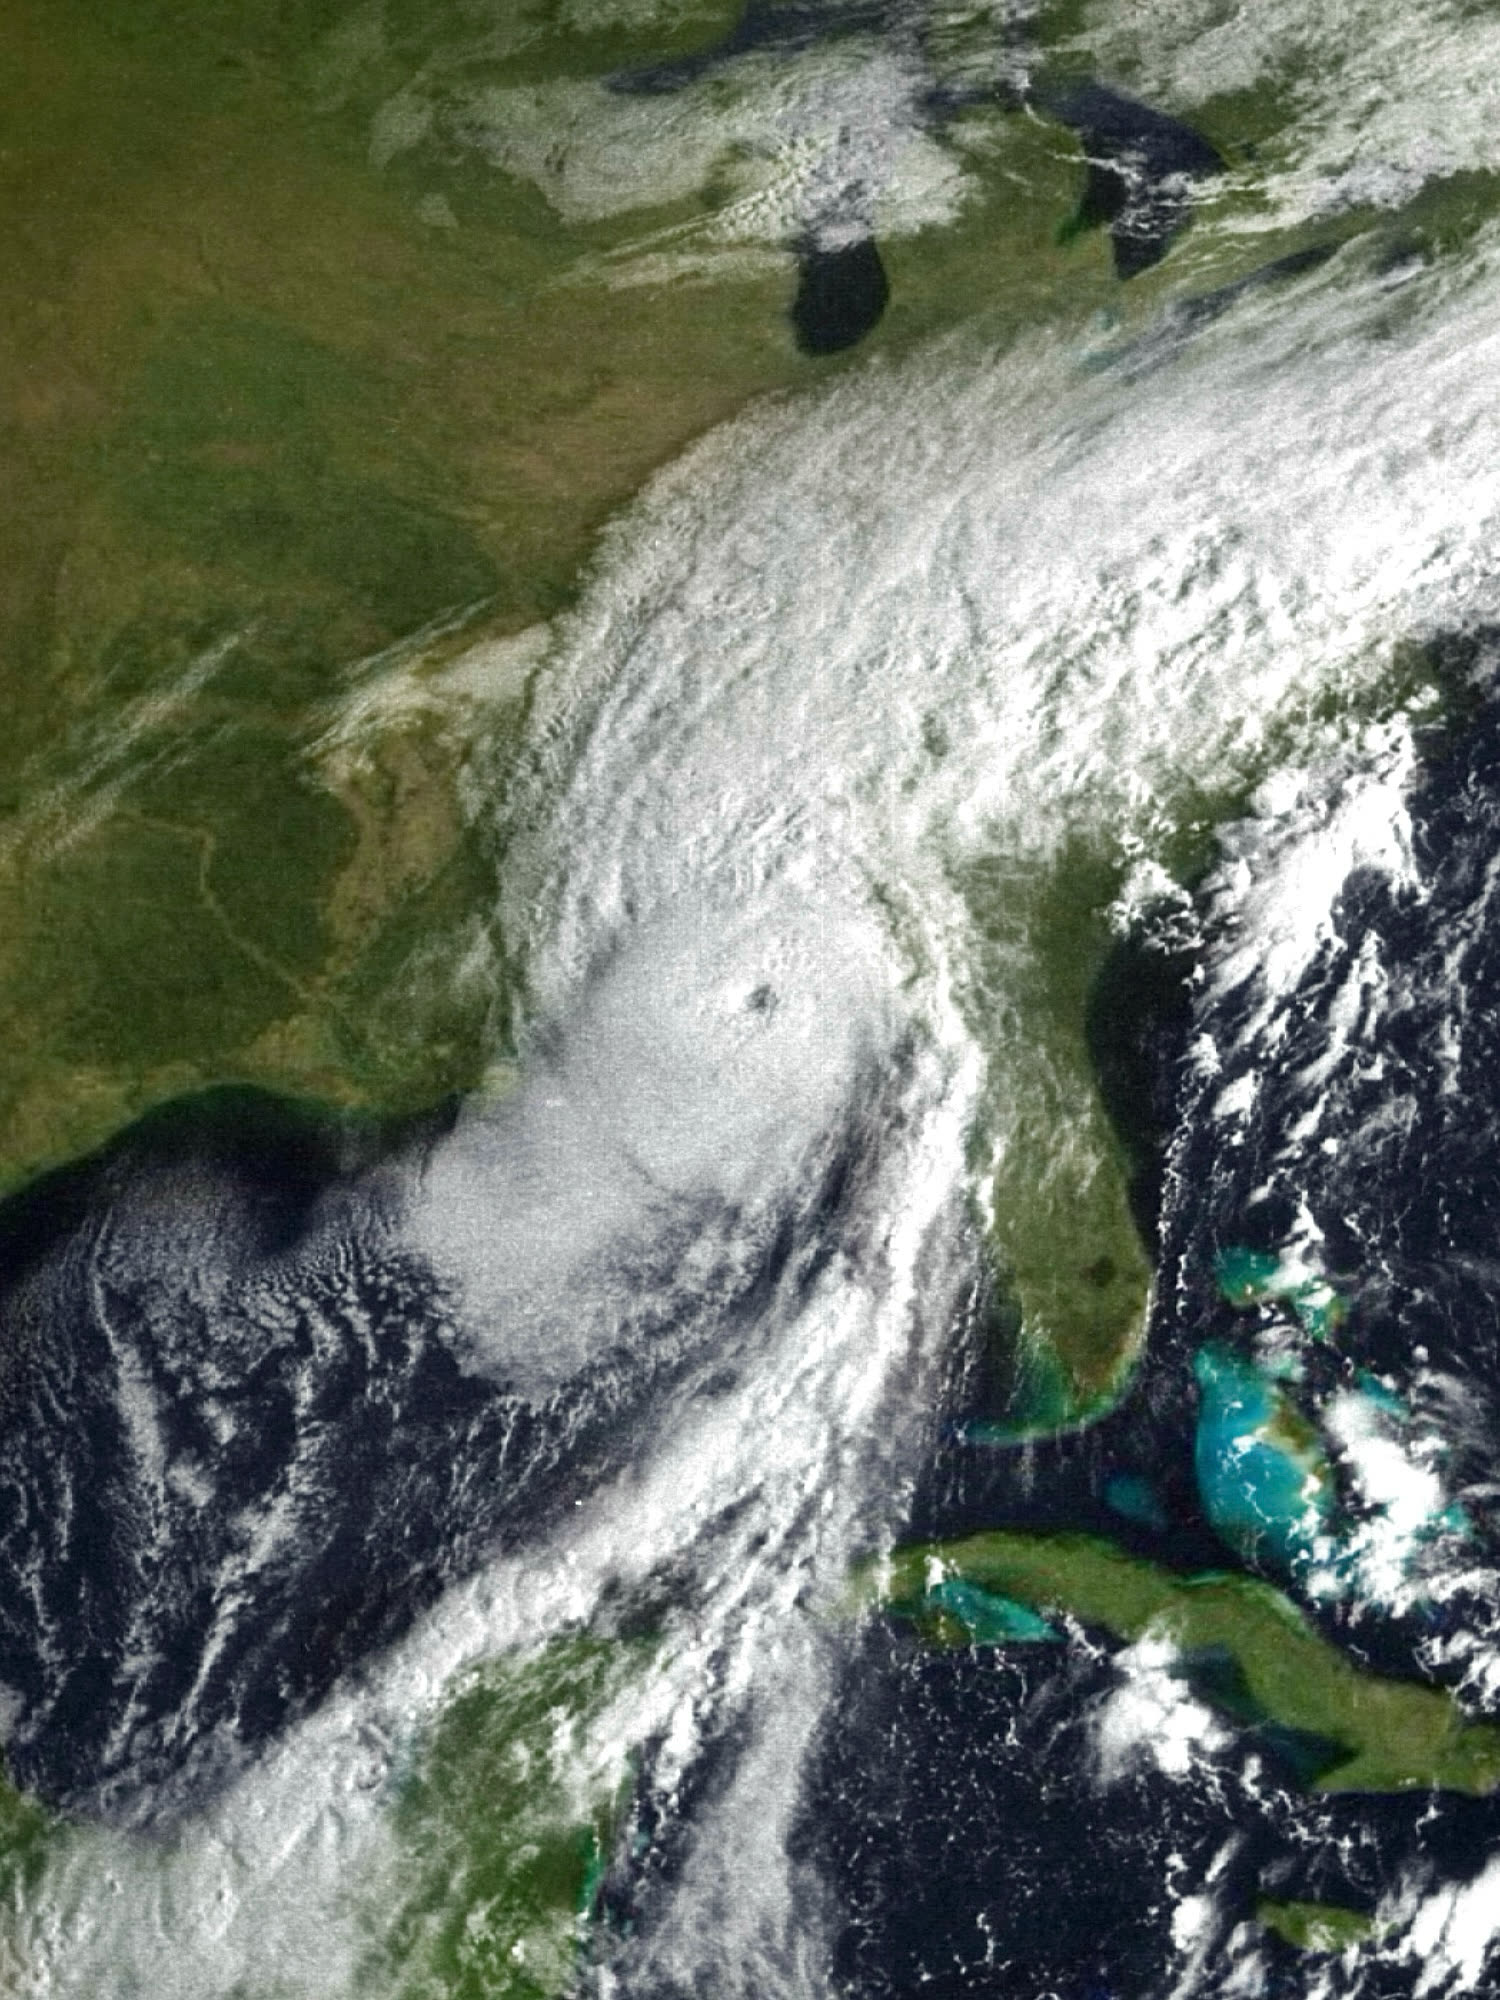
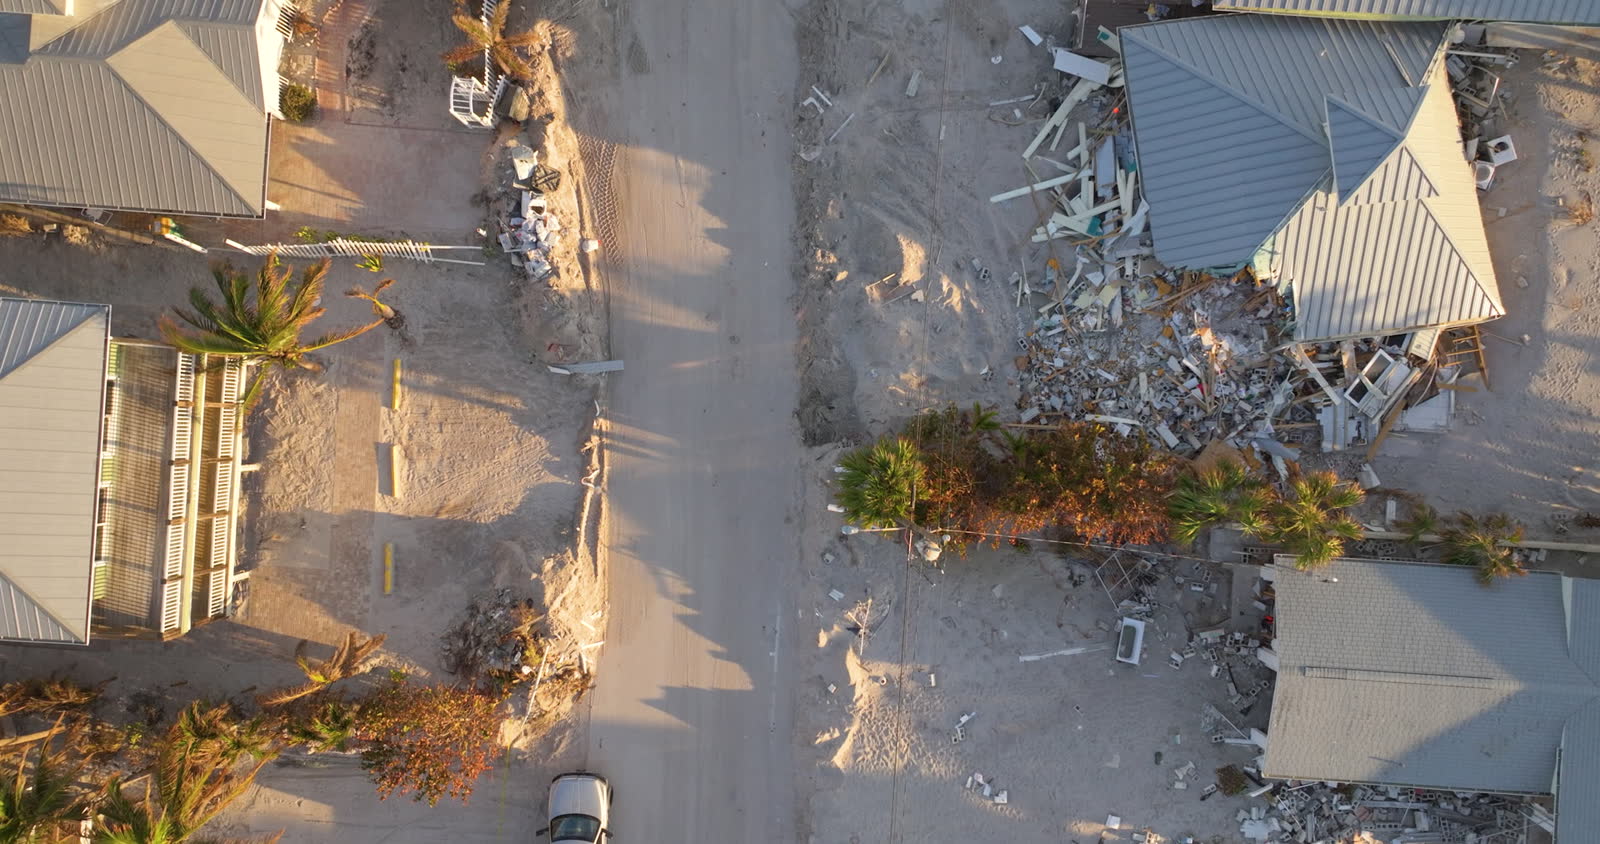
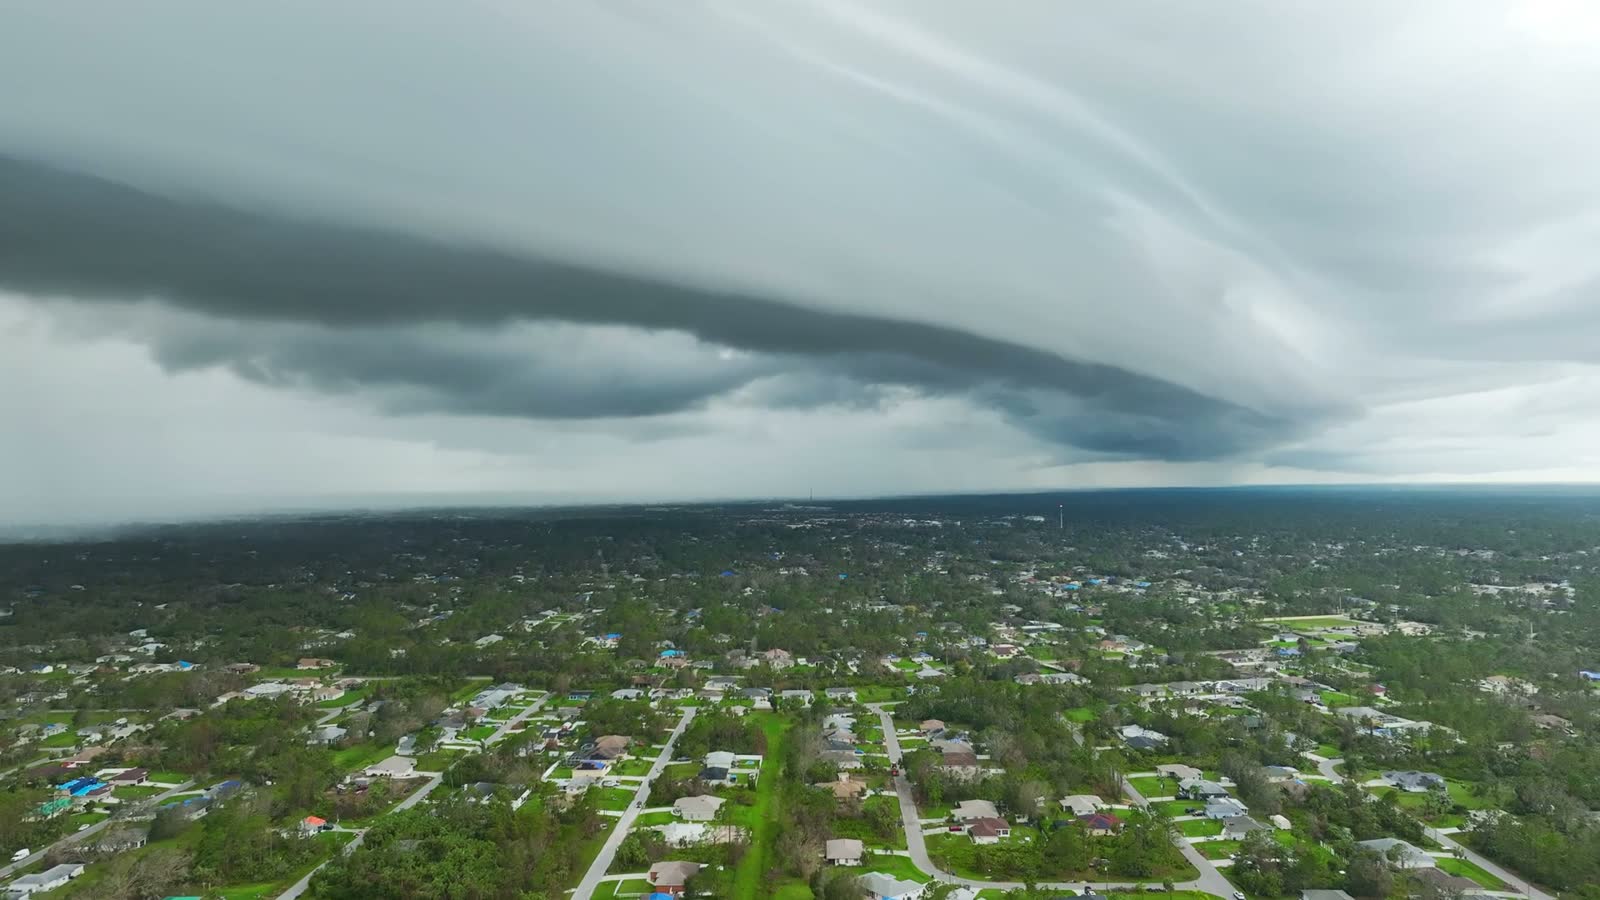
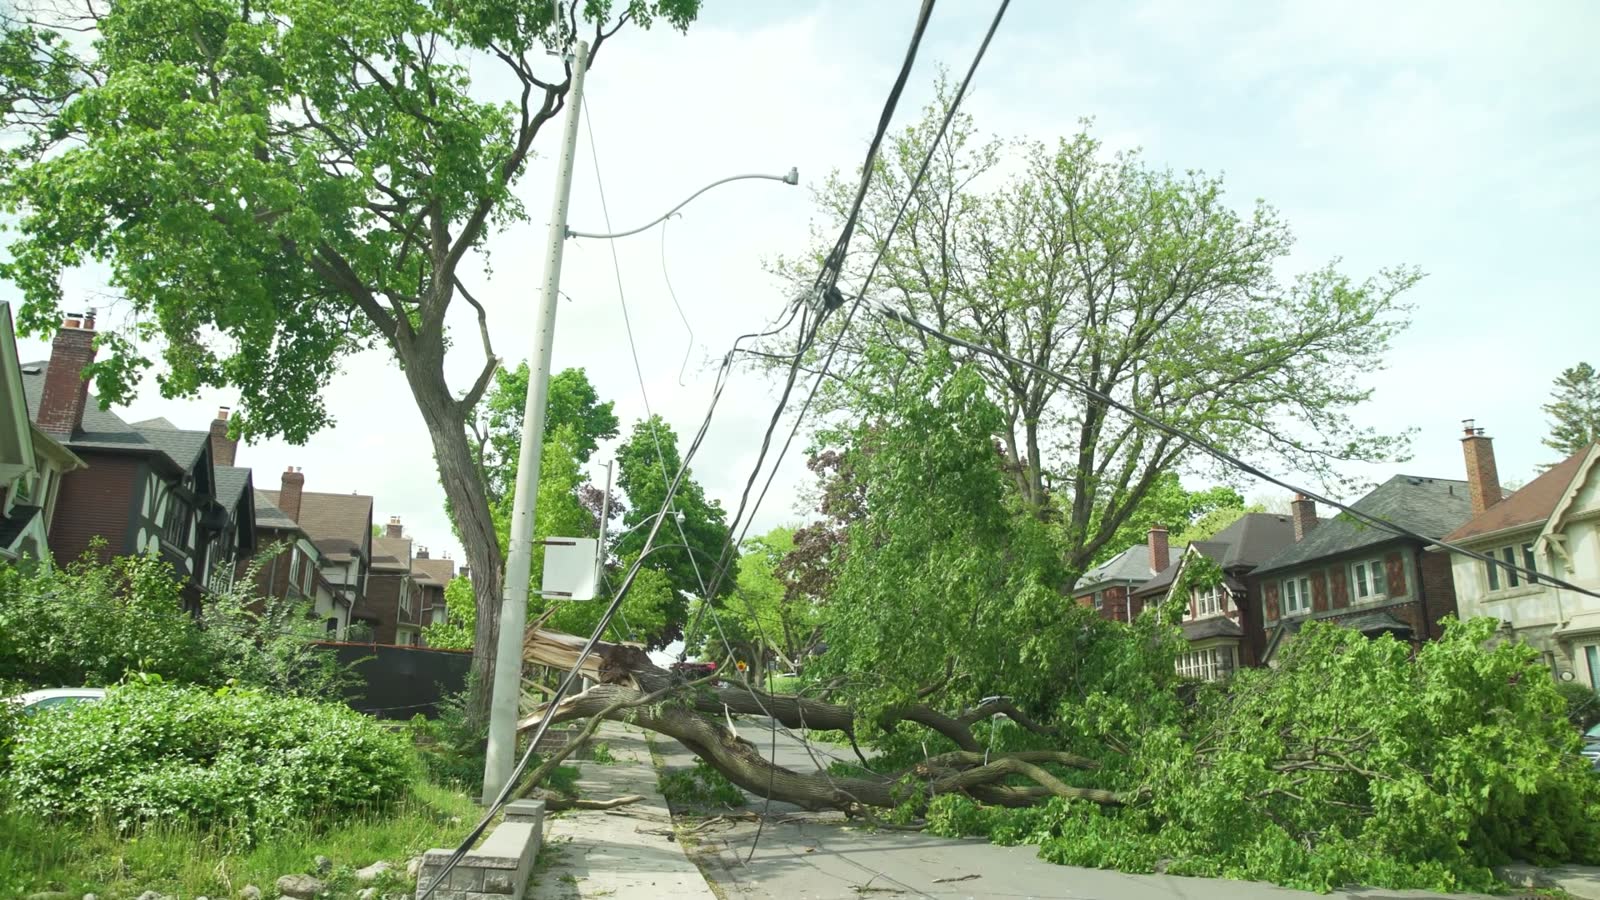
Representative peril imagery, the damage types that drive Florida property claims.

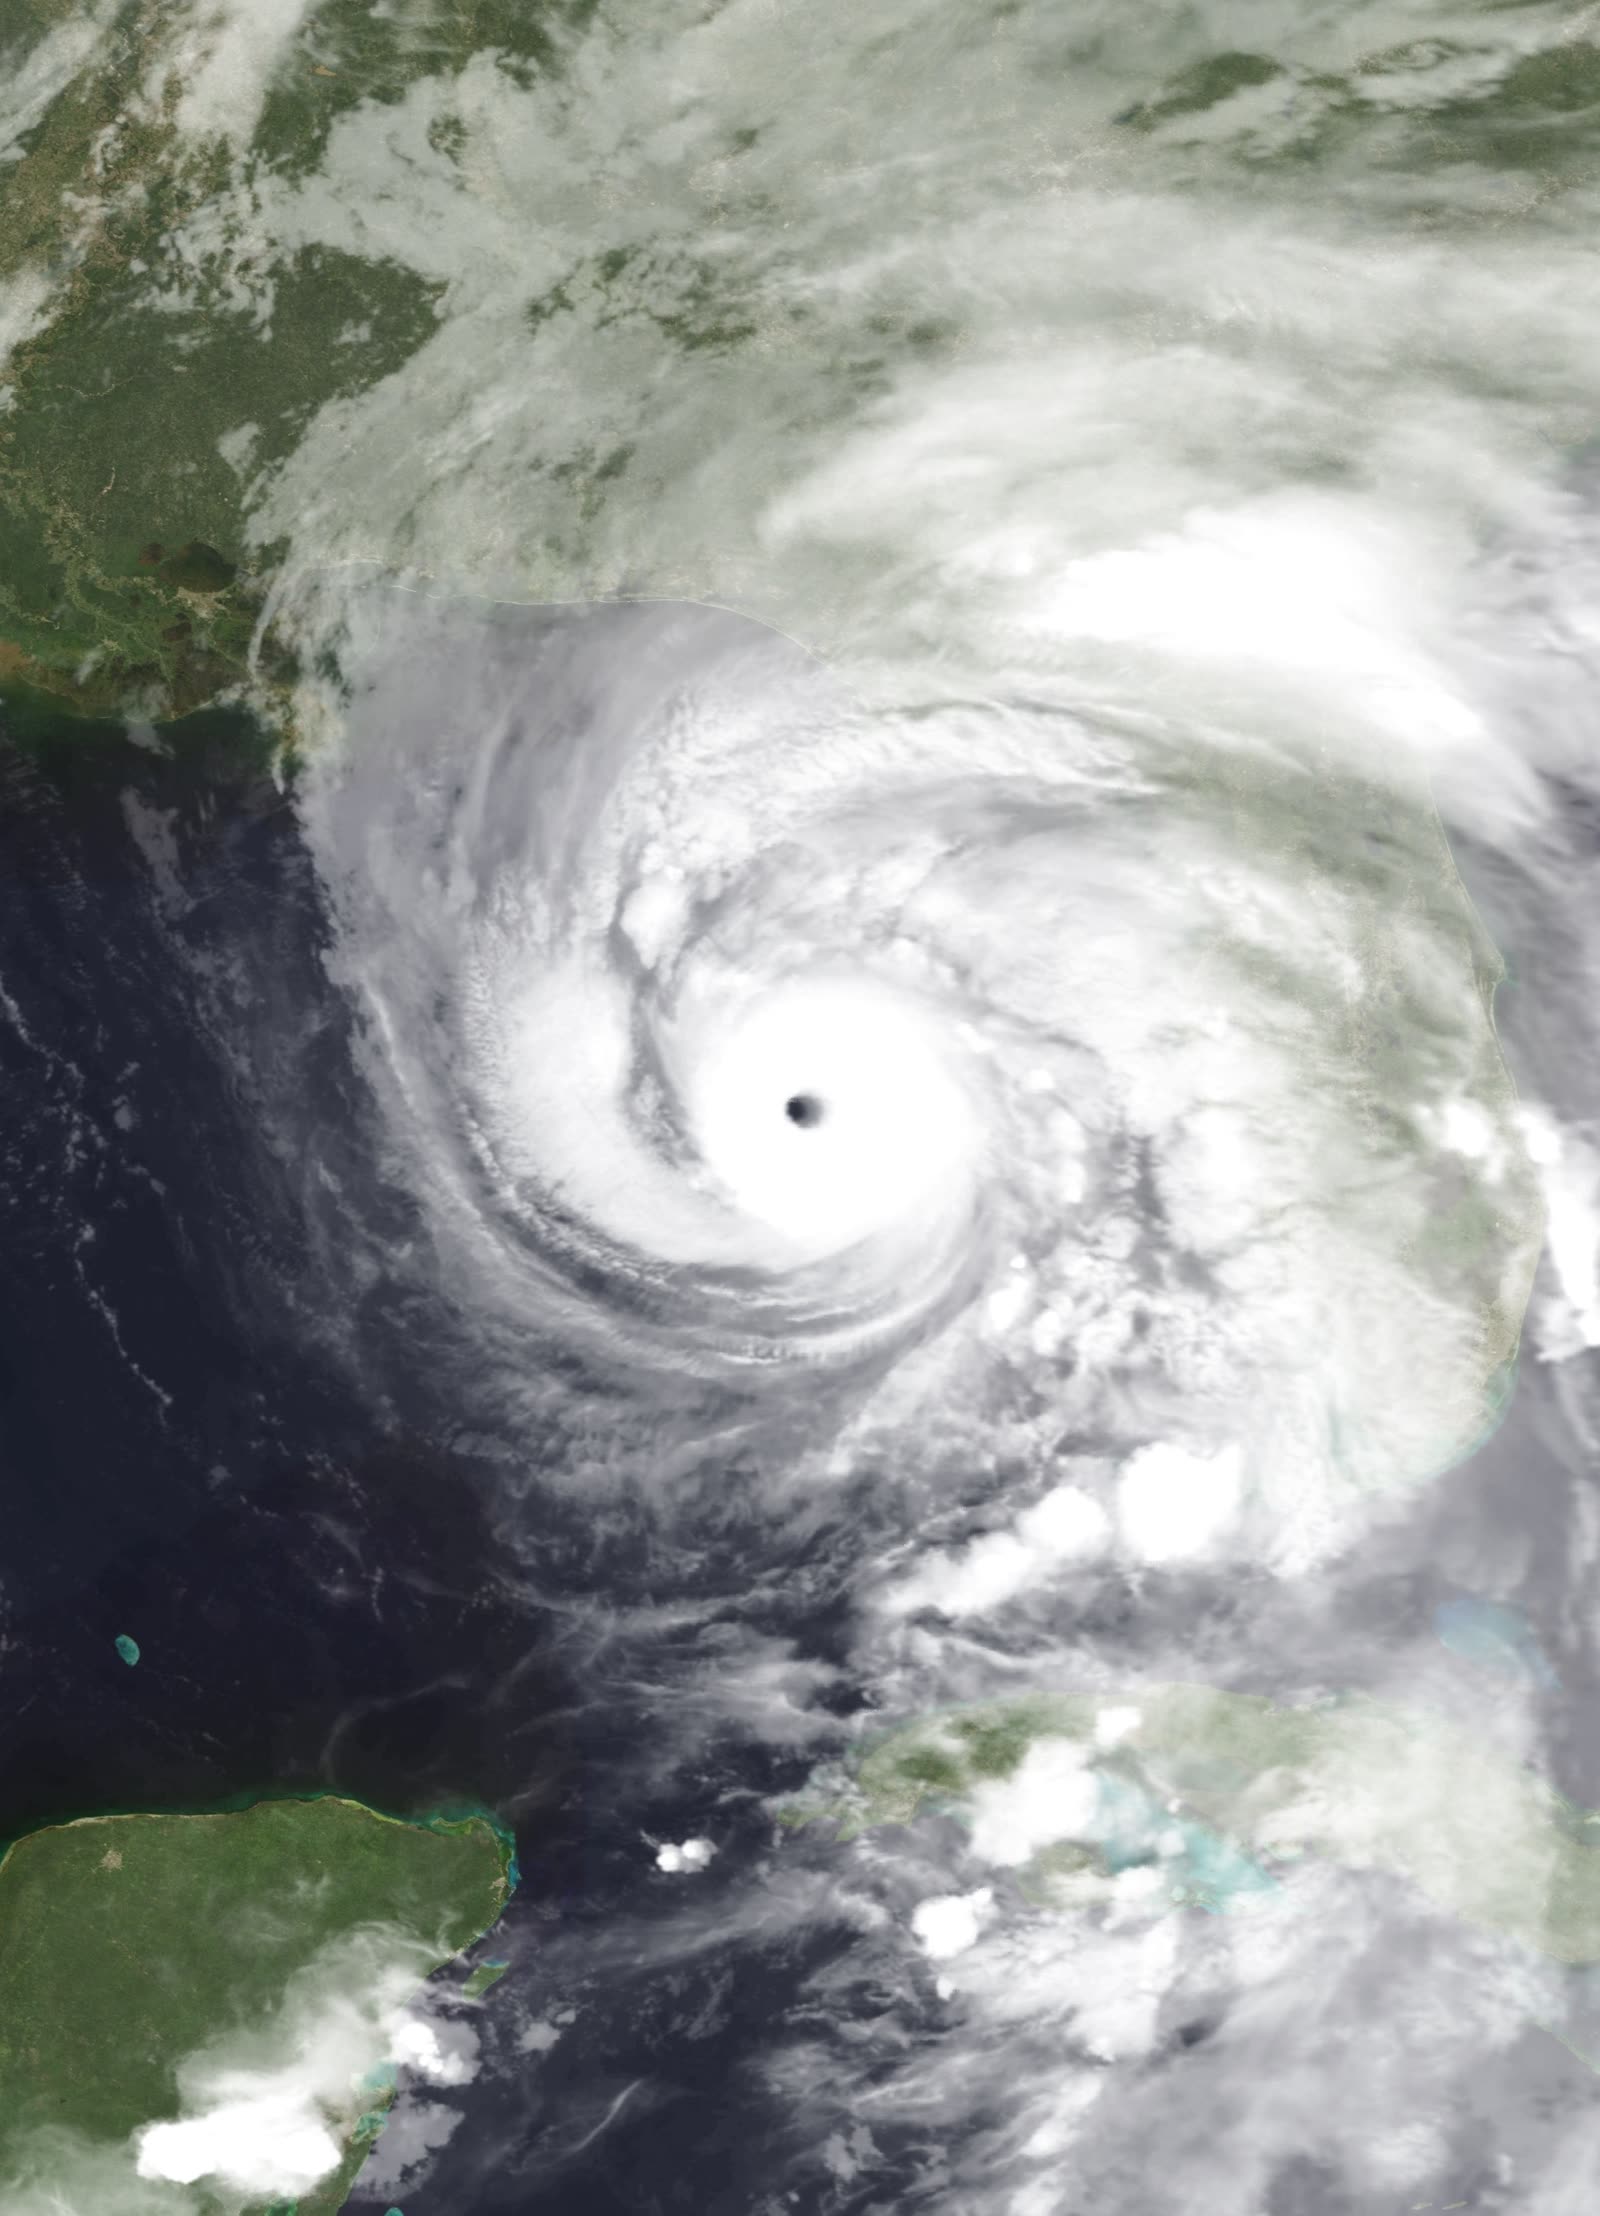
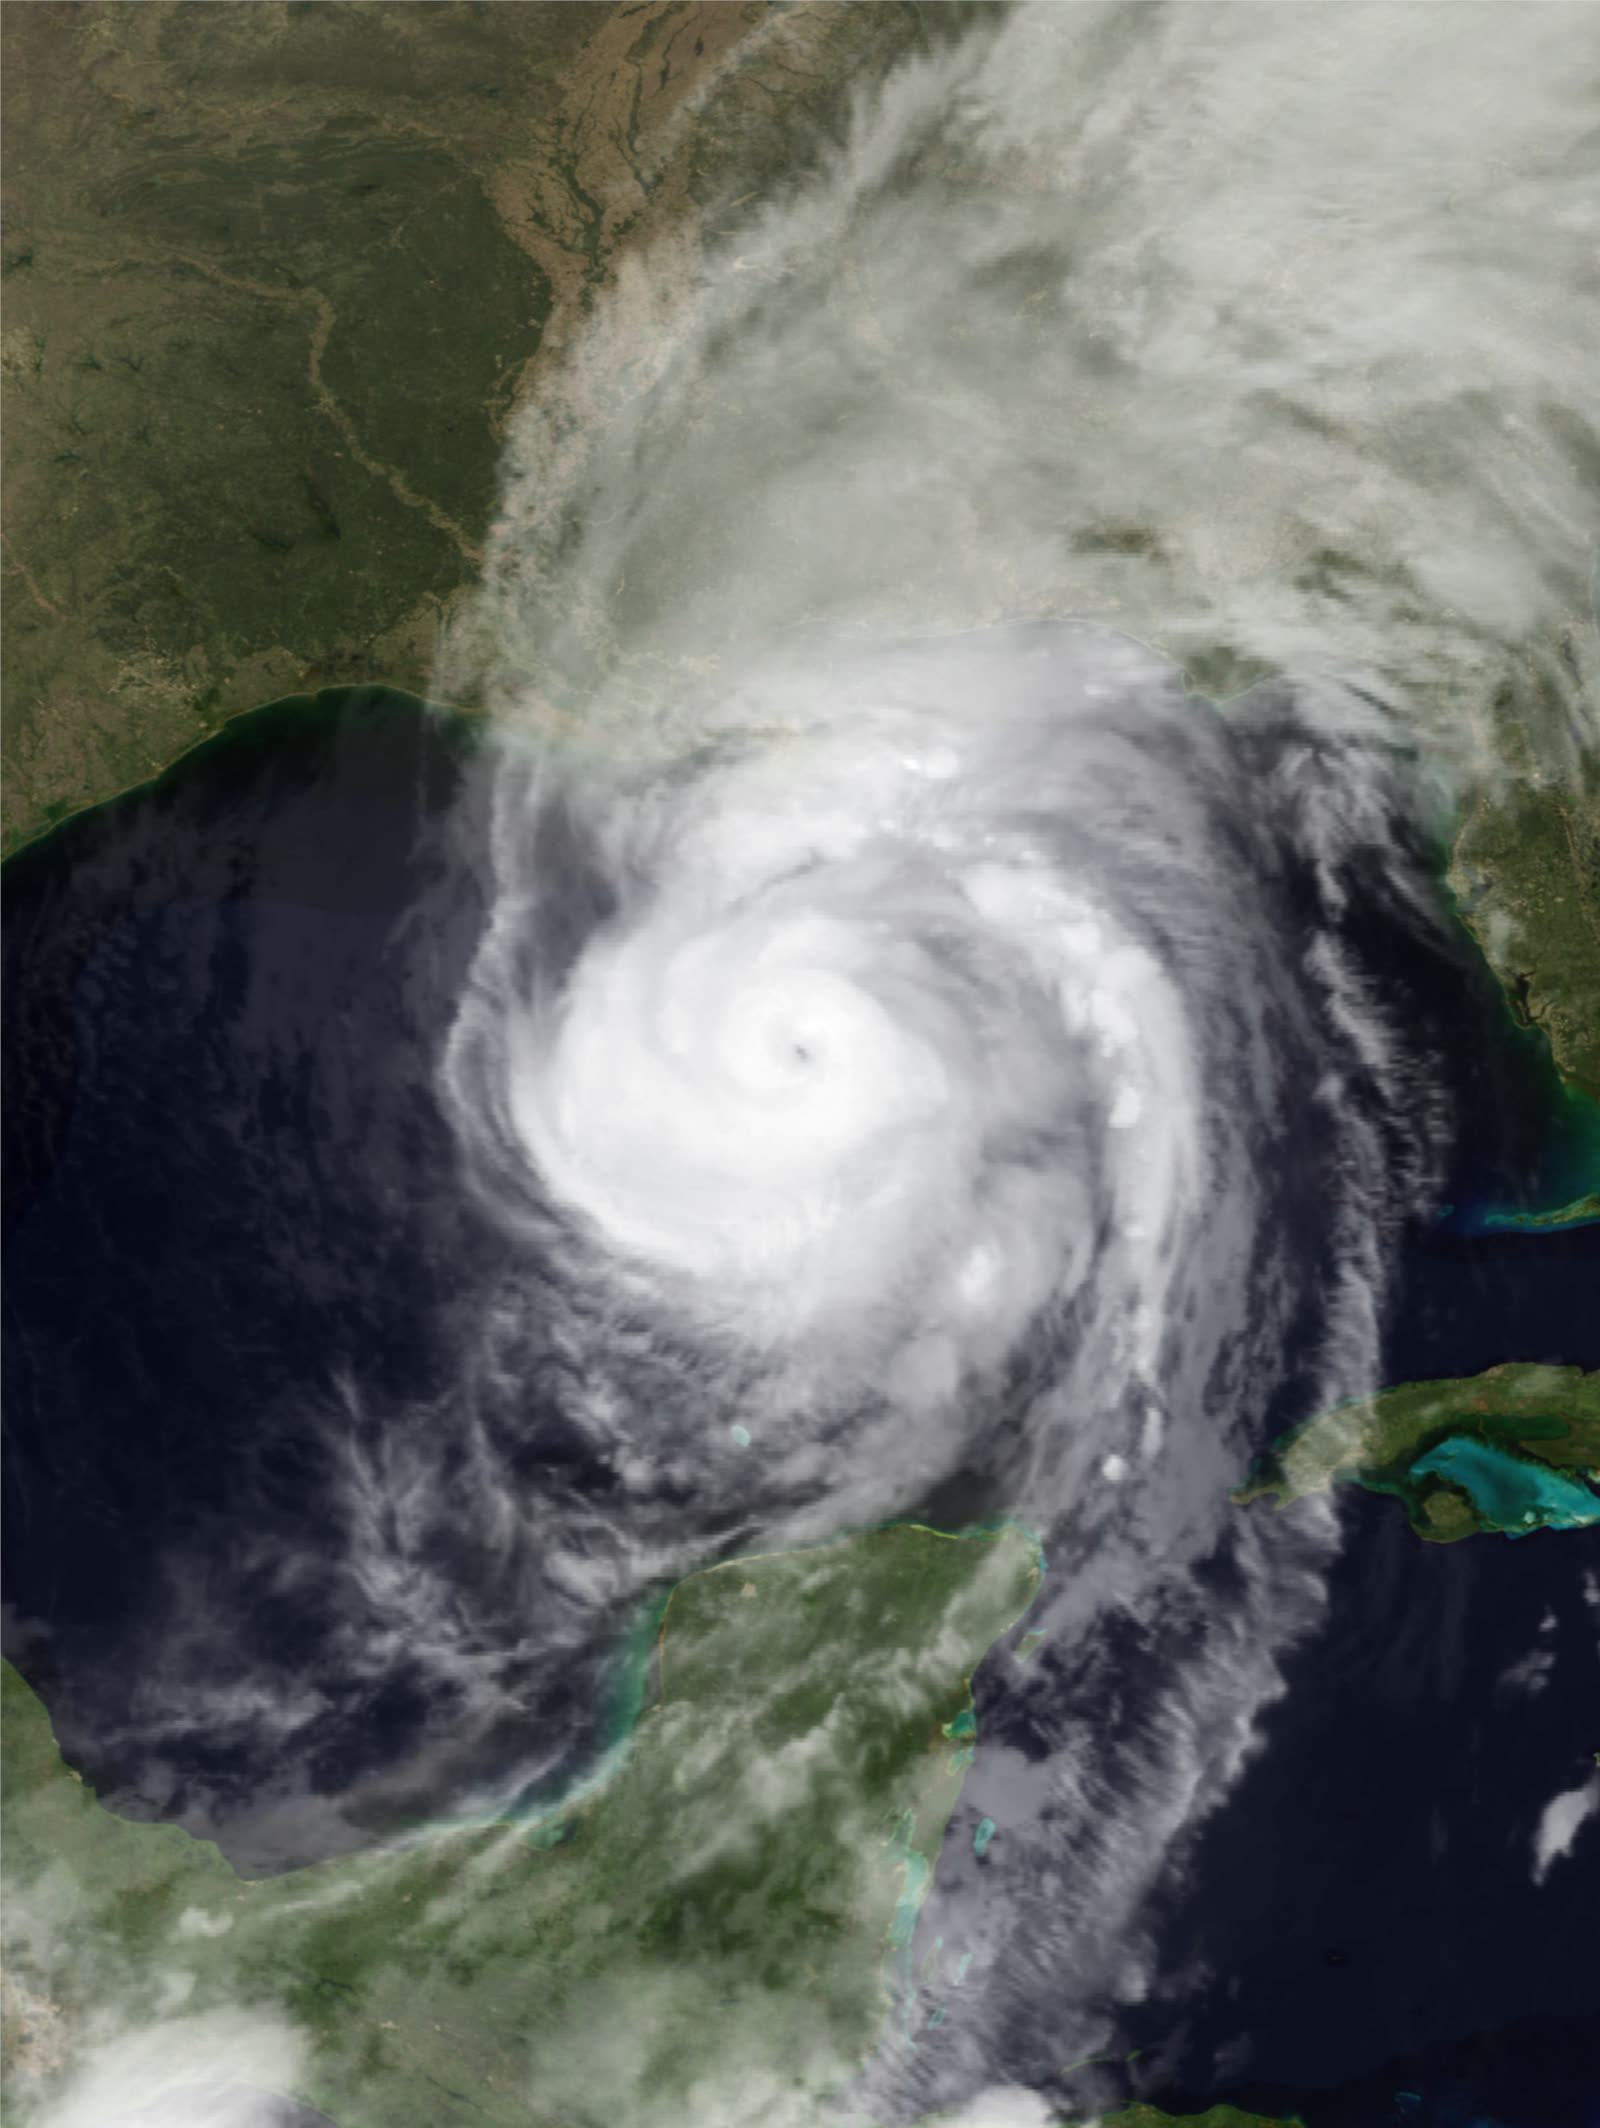
Hurricane Eloise came ashore at Panama City Beach in 1975 with a 12 to 16 foot surge, and became the storm that put teeth in Florida’s Coastal Construction Control Line. Opal raked the same coast in 1995 and Dennis followed in 2005. In October 2018 Hurricane Michael made landfall at Mexico Beach as a Category 5, driving its eyewall across eastern Bay County and hurricane conditions west along the beaches. The claims those storms produce raise the hardest question in Florida property insurance: which storm, and which peril, owes for the damage?

What Panama City Beach claims turn on

Surge is flood, and flood is excluded from every homeowners policy. It takes an NFIP or private flood policy. Wind is covered, behind a hurricane deductible calculated as a percentage of the home’s insured value, not of the loss. The FEMA map here makes the split unusually sharp: much of the Gulf-front ridge maps Zone X while Grand Lagoon, Bay Point and the West Bay shorelines are AE or A, so two homes a mile apart can carry completely different flood coverage on the same storm.

The condo stock adds another layer. A master policy covers the building envelope while unit owners carry HO-6 coverage for the interior, and after a storm the two carriers argue over where one ends and the other begins. A unit that both flooded and took wind can put three carriers in the same fight.

The law here

Florida gives you one year from the date of loss to give notice of a hurricane claim and 18 months for a supplemental claim (§ 627.70132, as amended by SB 2-A in 2023). The carrier must pay or deny within 60 days of a complete proof of loss (§ 627.70131). For storms already years past, those notice windows have generally closed, but a claim you already filed that was denied or underpaid can still have options, and the deadline to sue on a filed claim is longer. These are general figures. Confirm the current statutes and your own dates before relying on them. Not legal advice; consult an attorney about your specific claim.
FLOOD-ZONE MAP
FEMA NFHL · LIVE

Where the high-risk flood zones are in Panama City Beach

This is Panama City Beach drawn live from FEMA’s National Flood Hazard Layer. Every shaded area is a Special Flood Hazard Area, a high-risk zone where a federally backed mortgage requires flood insurance, and the first thing a carrier checks after a water loss. Your homeowners policy does not cover flood; that takes a separate NFIP or private flood policy. Pan and zoom to your street to see your zone.

FEMA FLOOD ZONES · PANAMA CITY BEACH Loading live data…
Zone VE
Coastal high-hazard. Storm surge with waves on top, the most dangerous zone, along the open water.
Zone AE
The 1%-annual-chance floodplain (the “100-year” zone). FEMA sets a Base Flood Elevation here.
A / AH / AO
Other high-risk areas, shallow sheet flooding, ponding, or floodplain not yet studied in detail.
Unshaded (X)
Moderate-to-low risk, not no risk. Over a quarter of federal flood claims come from outside the high-risk zones.
Drawn live from FEMA’s National Flood Hazard Layer. Absence of shading is not a guarantee against flooding; confirm your exact address at the FEMA Map Service Center.
LIVE CONDITIONS
NWS · NOAA · LIVE

Radar, forecast & tides for Panama City Beach

Live from the National Weather Service and NOAA, the local Doppler loop, the official 7-day forecast, and the next high and low tides. Tides and surge timing decide how bad a coastal flood gets; a storm arriving at high tide floods far more than the same storm at low tide.

DOPPLER RADAR · KEVXNWS NEXRAD · IEM
NWS NEXRAD base reflectivity radar near Panama City Beach
Latest base-reflectivity scan, NWS NEXRAD via IEM. Full interactive radar ↗
7-DAY FORECASTNWS
Loading NWS forecast…
NEXT TIDESNOAA · Panama City Beach
Loading NOAA tide predictions…
MARINE FORECAST · ST. ANDREWS BAYNWS
Loading NOAA coastal-waters forecast…

Source: NOAA National Weather Service & CO-OPS Tides & Currents, public domain. Tide heights are predictions (datum MLLW), not observed water levels. During a storm, follow official NWS warnings, not this page.

NEIGHBORHOOD RISK

How the risk changes across Panama City Beach

Flood exposure is hyper-local. These are the broad patterns by area, keyed to FEMA zones and the way water moves here, surge off the bay, the Bay County river system, and low interior drainage. General reference only; confirm your exact address on the map above.

Front Beach Road / Pier Park X (0.2% band)
COASTAL FLOOD

The Gulf-front tourist spine sits on a high beach ridge and maps largely Zone X inside the 0.2 percent annual-chance band. Wave and wind exposure are still the highest in the city.

Carillon Beach VE
STORM SURGE

Far west end at the Walton County line, mapped VE: coastal high hazard with wave action on top of surge.

Grand Lagoon / Thomas Drive AE
COASTAL FLOOD

Lagoon-front blocks map AE, with Zone X a street or two back. Surge and tidal backup drive the water claims here.

Bay Point AE
COASTAL FLOOD

Gated peninsula on Grand Lagoon and St. Andrews Bay, mapped AE along the water.

West Bay shoreline A
SURGE + FLOOD

North side along West Bay, mapped Zone A: high risk with no detailed base flood elevation studied.

Breakfast Point X
INLAND / LOWER

Newer interior development north of the Parkway, mapped Zone X. Wind, roof and screen-enclosure damage lead claims.

Back Beach Road corridor X
INLAND / LOWER

The US-98 commercial spine and the lots behind it sit higher and map Zone X.

Lullwater / east of Thomas Drive X
INLAND / LOWER

Interior neighborhoods off the lagoon, mapped Zone X. Wind and tree fall are the main perils.

STORMS THAT HIT PANAMA CITY BEACH
LOCAL RESOURCES
GOV · NOAA · FEMA

Panama City Beach disaster, insurance & mitigation resources

The official sources, emergency management, weather, insurance regulators, and property maps. Links open in a new tab; agencies change their sites, so if one has moved, search the agency name.

Links to government & NOAA sources, public domain. Listing a resource is not endorsement. Flood zones and elevations are general reference; confirm your exact address with the official source before acting.

WHO YOU'RE DEALING WITH
FREE CASE REVIEW · NO FEE UNLESS YOU RECOVER
Panama City Beach property claim denied?
CALL SC · 843-542-0454CALL FL · 813-588-0164FREE CLAIM REVIEW
PANAMA CITY BEACH · FREE CLAIM REVIEW

Filed a claim in Panama City Beach and got denied or underpaid?

Upload your denial letter, policy, and photos. A property-insurance attorney reviews it and tells you where you stand. Free, no obligation.

Claim deadlines are strict and vary by policy and date of loss; some have already passed. This is general information, not legal advice; ask a licensed attorney about your specific dates.

THE ADJUSTER'S FILEREPRESENTATIVE FOOTAGE
CASE FILE · HL-2026 · INTAKE OPEN
FREE CASE REVIEW
PROPERTY INSURANCE CLAIM
REVIEWED BY HALVERSEN LAW
01Who you are
02Your claim
03Your documents
Drop your documents here, or tap to browse
Denial letter · policy · adjuster estimate · damage photos, PDF, JPG, PNG, HEIC or DOC, up to 25MB each
HurricaneLaw.Pro, Florida and South Carolina property insurance claim resource HURRICANELAW.PRO

A comprehensive property-insurance claim resource for policyholders: denied and underpaid claims, coverage and bad-faith law, storm dossiers, carrier profiles, city guides, and the complete claims playbook. Florida and South Carolina.

▸ SEE THE FULL SITE MAP →
STORM ALERTS SOURCED FROM NOAA / NHC
SOUTH CAROLINA
496 Bramson Court, Suite 100
Mount Pleasant, SC 29464
CALL OR TEXT
FLORIDA
CALL OR TEXT
CLAIMS 9
BAD FAITH 7
DENIAL FILINGS
HOW CLAIMS GET DENIED
DENIAL DOCUMENTS
DENIALS, ANSWERED 9
COVERAGE 12
COMMERCIAL 8
ROOFS 8
TREES 5
DIRECTORIES
STORMS 51
WEATHER
NEWS & SITE 20
STORM ARCHIVE, CITIES & NEWS
Most recent below. Every storm dossier, city resource, and article is on its hub (linked at each heading) or the grouped site map →. All 81 carriers and 95 public-adjuster firms are in the Directories column above.
STORM ARCHIVE · 51 →
Hurricane Debby 2024Hurricane Helene 2024Hurricane Milton 2024Hurricane Idalia 2023Hurricane Ian 2022Hurricane Nicole 2022Hurricane Ida 2021Hurricane Laura 2020 View all 51 →
FLORIDA CITY RESOURCES · 37 →
Boca RatonBradentonCape CoralClearwaterCrestviewDaytona BeachDestinDunedin View all 37 →
SOUTH CAROLINA CITY RESOURCES · 8 →
BeaufortCharlestonColumbiaFlorenceGreenvilleHilton Head IslandMount PleasantMyrtle Beach
NEWS & UPDATES · 20 →

Coverage summaries, policy-language quotations, dollar figures, deadlines, and chart examples throughout this site are general information based on typical or standard policy forms and are illustrative only: they are not a quote, a guarantee of coverage, or a promise of any outcome. Every insurance policy is different: your own policy, endorsements, and state law control, so read your policy and confirm current statutes. Weather imagery courtesy of NOAA, the National Hurricane Center, and the National Weather Service. Legal services are provided by Halversen Law. Nothing on this site is legal advice; consult an attorney about your specific claim.
PrivacyTermsDisclaimerAboutContact
This site is not legal advice, and it is not a substitute for an attorney. We build the best claim resource we can, but anything legal needs a licensed lawyer reading your policy and your facts. We recommend Halversen Law: the free claim review is the fastest way to get real eyes on your claim.
© 2026 HURRICANELAW.PRO · ALL RIGHTS RESERVED 27.9°N 82.5°W · ATLANTIC BASIN MONITOR
LAW FIRM
Halversen Law LICENSED · FLORIDA & SOUTH CAROLINA

Legal matters are handled by Halversen Law, a law firm licensed in Florida and South Carolina.

FREE CASE REVIEW